Government, Resources, Work
Unauthorized Asian immigrants living in the United States
Unauthorized immigrants from Asia often do not fit into American stereotypes of undocumented immigrants. Most are highly educated and tend to work in white-collar jobs. They constitute 10% to 16% of the U.S. unauthorized immigrant population in 2022. Immigrants from India, China, the Philippines, and Korea account for 75% of the total U.S. unauthorized Asian immigrant population. Where they live, how educated they are, and what work they do, varies by their country of origin.

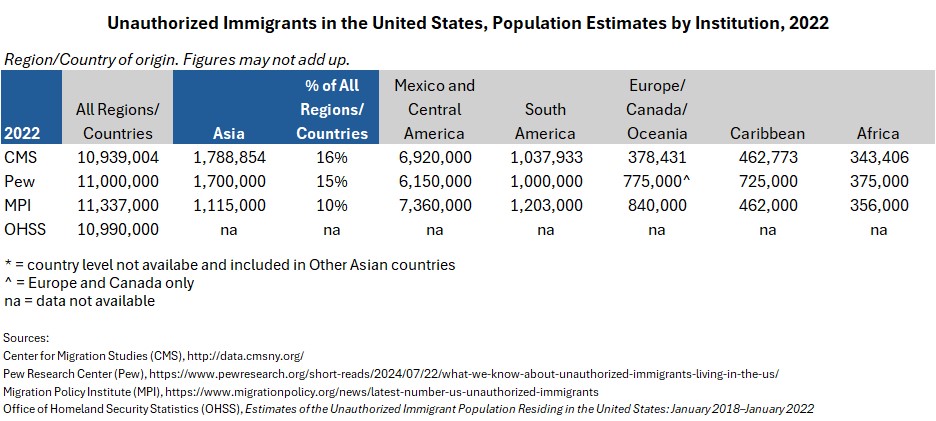
Immigrants from Asia constitute 10% to 16% of the U.S. unauthorized immigrant population in 2022. Their numbers range from 1.1 million per Migration Policy Institute (MPI) to 1.7 million or higher per Pew Research Center (Pew) and the Center for Migration Studies (CMS).

Unauthorized Asian immigrants are highly educated and tend to work in white-collar jobs
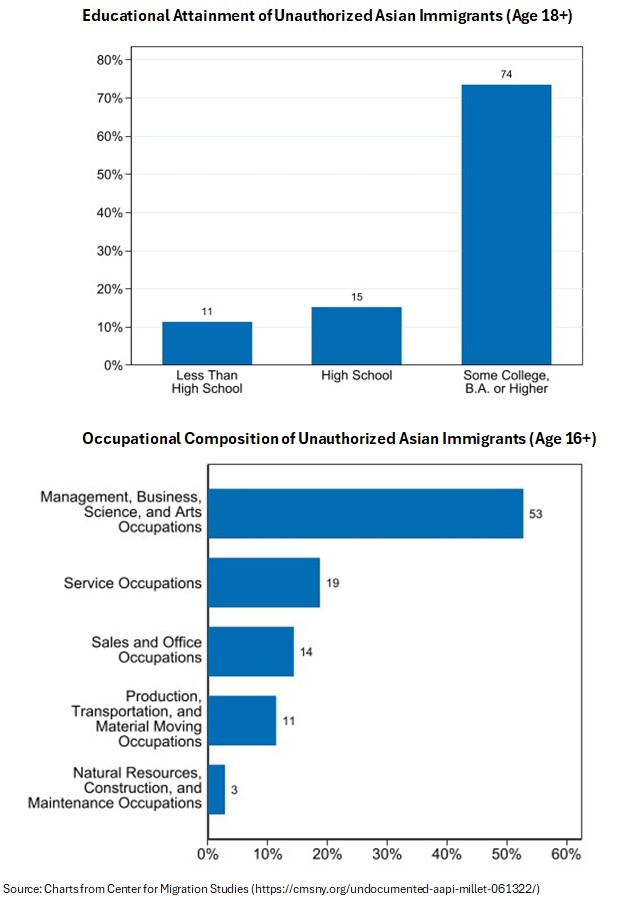
Unauthorized immigrants from Asia often do not fit into American stereotypes of undocumented immigrants. According to CMS, they are highly educated, and tend to work in white-collar jobs. CMS estimates that over 40% of U.S. unauthorized immigrants are individuals who have overstayed their employment, student, or tourist visas. Perhaps not surprisingly, 74% of unauthorized Asian immigrants have some college or higher education and 53% work in management, business, science, and arts occupations or white-collar jobs. For comparison, only 19% of all U.S. unauthorized immigrants work in management, business, science, and arts occupations. Regardless of the occupation, undocumented immigrants contribute to the U.S. economy. In 2022, they paid a total of $97 billion in federal, state, and local taxes per the Institute on Taxation and Economic Policy.

Education and job disparities by country of origin
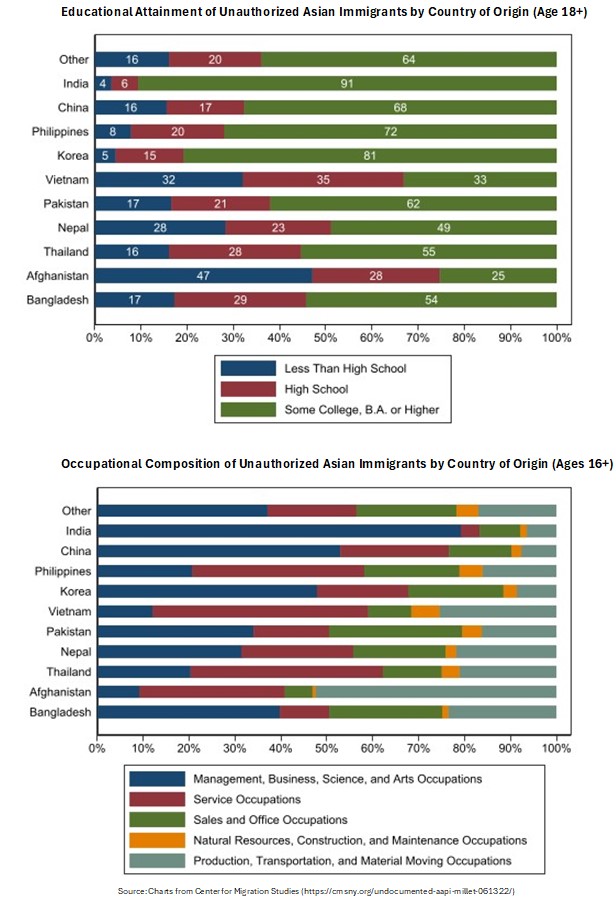
91% of unauthorized immigrants from India, 68% from China, 72% from the Philippines, and 81% from Korea have some college or higher education and tend to work in white-collar jobs. These 4 countries account for 75% of the total U.S. unauthorized Asian immigrant population. However, disparities exist by country of origin. For example, 67% of unauthorized immigrants from Vietnam and 75% from Afghanistan have a high school education or less and they are more likely to work in service or production, transportation, and material moving occupations. Moreover, high educational attainment does not always translate to white-collar work, as the case with immigrants from the Philippines and Thailand. Despite high educational attainment, they are more likely to work in service occupations.

Estimates by year of arrival
According to CMS data, a third of unauthorized Asian immigrants came to the U.S. between 2012 and 2015. The vast majority of unauthorized Asian immigrants are of prime working age: 70% are from 25 to 54 years old.
Total Undocumented Population from Asia and the Pacific Islands, by Year of Arrival

Population estimates by country of origin vary widely
Population estimates of unauthorized immigrants from India, China, and the Philippines vary widely across CMS, Pew, MPI, and OHSS as each has their own methodology. CMS and Pew found that the largest subgroup of unauthorized Asian immigrants came from India. Their estimates were at 693,394 and 725,000, respectively, in 2022. OHSS and MPI estimates for India are 220,000 and 375,000, respectively. According to OHSS data, unauthorized immigrants from the Philippines are the largest subgroup at 350,000 within their reporting.

Population estimates by U.S. state and country of origin
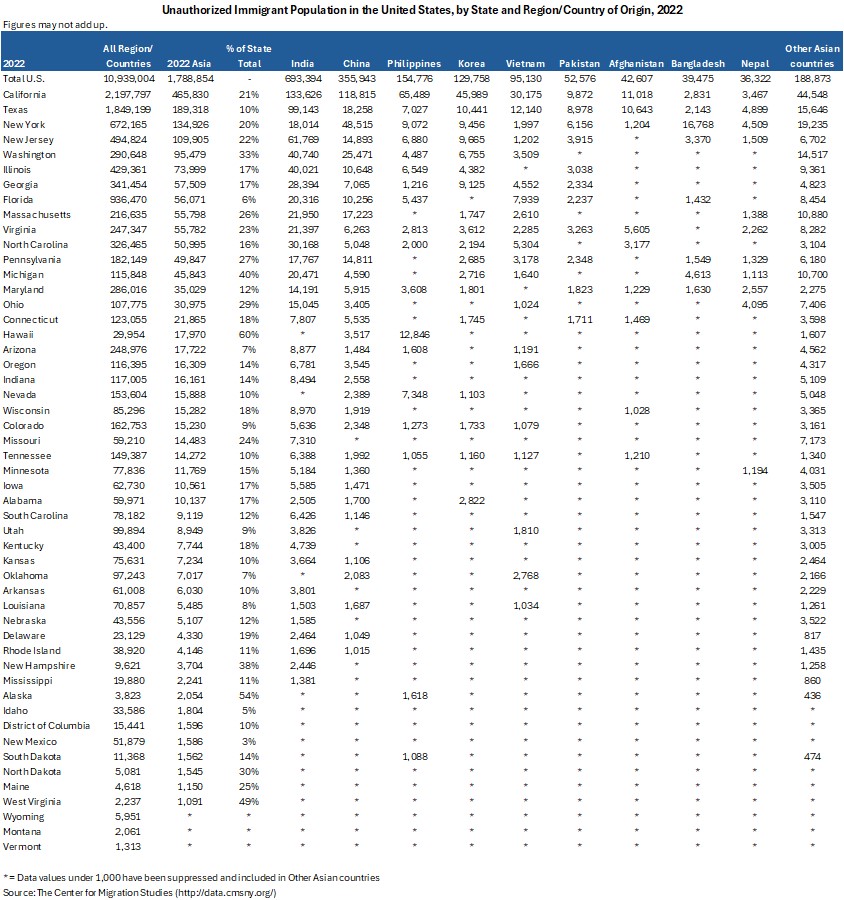
Per CMS data, unauthorized Asian immigrants are concentrated in 4 states – California (465,830 or 26%), Texas (189,318 or 11%), New York (134,926 or 8%), and New Jersey (109,905 or 6%). California is by far home to the greatest number of unauthorized Asian immigrants: 1 in every 4 unauthorized Asian immigrants lives in California, where they constitute 21% of California’s unauthorized immigrant population.

- India (693,394)
- 48% live in 4 states – California (133,626 or 19%), Texas (99,143 or 14%), New Jersey (61,769 or 9%), and Washington (40,740 or 6%). Largest Asian subgroup across most states. Their population is 4x – 6x larger than the second largest unauthorized Asian population, particularly in Texas (5x), New Jersey (4x), North Carolina (6x), and Georgia (4x).
- China (365,943)
- 54% live in 3 states – California (118,815 or 33%), New York (48515 or 14%), and Washington (25,471 or 7%). Largest subgroup in New York.
- Philippines (154,776)
- 42% live in California (65,489). Largest subgroup in Hawaii (12,846), Alaska (1,618), and South Dakota (1,088).
- Korea (129,758)
- 35% live in California (45,989). Another 30% live in 4 states – Texas (10,441 or 8%), New Jersey (9,665 or 7%), New York (9,456 or 7%), and Georgia (9,125 or 7%).
- Vietnam (95,130)
- 53% live in 3 states – California (30,175 or 32% ), Texas (12,140 or 13%), and Florida (7,939 or 8%). Largest subgroup in Oklahoma.
- Pakistan (52,576)
- 48% live in 3 states – California (9,872 or 19%), Texas (8,978 or 17%), and New York (6,156 or 12%).
- Afghanistan (42,617)
- 64% live in 3 state – California (11,018 or 26%), Texas (10,643 or 25%), and Virginia (5,605 or 13%).
- Bangladesh (39,475)
- 43% live in New York (16,768).
- Nepal (36,322)
- 14% live in Texas (4,899) and 12% in New York (4,509)

Unauthorized Asian immigrants living in the U.S. are a diverse and complex population. Estimates on their population vary widely, and their demographics challenge common stereotypes about undocumented immigrants.
Helpful Resources
Estimates of the Unauthorized Immigrant Population Residing in the United States (Office of Homeland Security Statistics, U.S. Department of Homeland Security)
Estimates of Undocumented and Eligible-to-Naturalize Populations by State (The Center for Migration Studies)
What we know about unauthorized immigrants living in the U.S. (Pew Research Center)
Diverse Flows Drive Increase in U.S. Unauthorized Immigrant Population (Migration Policy Institute)
Get a monthly dose of our latest insights!


About
myasianvoice
At MyAsianVoice, we connect Asian Americans to surveys and research to bridge the Asian data gap.
Join our growing respondent list >>
