Family, Government, Health, Resources
Asian women have higher marriage rates and much lower divorce
We hear the statistic that half of all marriages end up in divorce, but is that true for Asian Americans? For Asian women, we have a higher marriage rate and much lower divorce than the national average from the latest U.S. Census publication, yet our narrative is not visible in the national numbers.

Marriage and divorce are key events that shape many areas of our lives, including our happiness, health, and financial well-being. Asian women have a higher marriage rate and much lower divorce than the national average per the latest U.S. Census publication, yet our narrative is not visible in the national numbers. So, what does the publication say about Asian marriages and divorces?
We marry a little older
We marry a little older. Asian women marry at the median age of 29. Asian men marry at the median age of 31. The national median age of first marriage has been increasing from 2008 to 2016. Nationally, women marry at the median age of 28 and men marry at the median age of 30.
More of us marry
More of us marry. The marriage rate shows the number of marriages for every 1,000 adult age 15 or older in a 12-month period. Nationally, the marriage rate decreased to 17 for women and 18 for men. Asian women and men have higher marriage rates. The marriage rate for Asian women is 20 and for Asian men is 21.
How many marriages were there? In 2016, there were 43.4 million marriages nationally. 3.4 million marriages were by Asians. Of the Asian marriages, 21% were interracial and a whopping 71% were by couples who are both foreign-born, the highest among any racial group.
More of us stay married
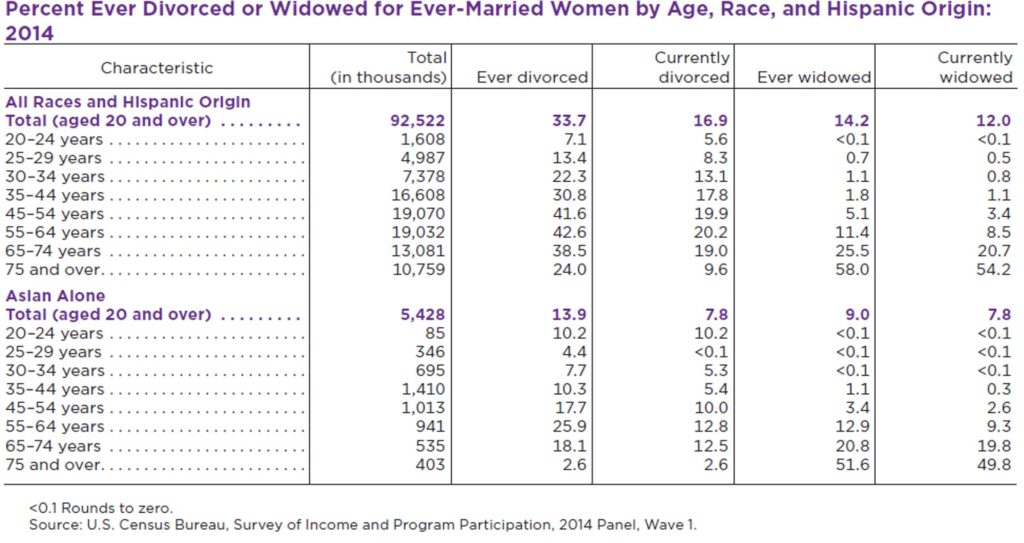
More of us stay married. When looking at divorces among all adult women, roughly 1 in 3 adult women or 34% have ever divorced. Asian women experience divorce at less than half of the national figure. Only 14% of Asian women have ever divorced. Asian men also experience lower divorce. 11% of Asian men have ever divorced compared to 33% for all men. Men tend to have lower divorce than women in general.

More of us do not ever marry
More of us do not ever marry. Across all racial groups and age groups, there was an increase from 2006 to 2016 in the proportion of women and men who were never married. In 2016, 8% of Asian women ages 45-54 never married (an increase from under 7% in 2006) and 6% of Asian women age 55 or older never married (an increase from 5.0% in 2006).

The U.S. Census used data from the 2016 American Community Survey (ACS) 1-year estimates, 2014 Survey of Income and Program Participation (SIPP) Wave 1 and 2014 Social Security Administration Supplement to provide a uniquely comprehensive look at marital patterns in the United States.
Helpful Resources
Number, Timing and Duration of Marriages and Divorces (PDF Report by U.S. Census Bureau)
American Community Survey (ACS)
Marriages, Divorce by Asian Sub-Racial Group (U.S. Census Bureau)
Marriages, Divorce by State and by Race (worldpopulationreveiw.com)
Get a monthly dose of our latest insights!


About
myasianvoice
At MyAsianVoice, we connect Asian Americans to surveys and research to bridge the Asian data gap.
Join our growing respondent list >>

