June is Pride Month. According to The Williams Institute at UCLA School of Law, an estimated 685,000 Asian American and Native Hawaiian and Pacific Islander (NHPI) adults identify as LGBT (Lesbian, Gay, Bisexual, and Transgender) in 2021, up from 324,600 in 2013. LGBT Asian Americans and NHPIs face unique intersectionality related to their marginalized identities and are more likely to experience mental distress and economic insecurity. Americans tend to view Asian American and NHPI LGBT individuals as more American. While sexual orientation may affect Asian American and NHPIs’ perceived “foreignness,” it does not protect against other forms of discrimination and harassment.
June is Pride Month. Little is researched and written about the demographics, health, and perception of Asian Americans and Native Hawaiians and Pacific Islanders who identify as LGBT in the United States. According to The Williams Institute at UCLA School of Law, in 2021, 4.5% of all Asian American and NHPI adults identify as LGBT, consisting of 3.8% for Asian American adults and 8.8% for Native Hawaiian and Pacific Islander adults. This translates to an estimated 685,000 Asian American and NHPI LGBT adults, a two-fold increase from 324,600 in 2013.
U.S. LGBT adult population
Using 2020-2021 data from the Behavior Risk Factor Surveillance System or BRFSS, a national survey by the CDC and each state’s health department, the Williams Institute estimates the total LGBT adult population to be 13.9 million or 5.5% of the total U.S. population in 2023. Recent population estimates by the Pew Research Center and Gallup are higher at 7.0% and 7.6%, respectively.
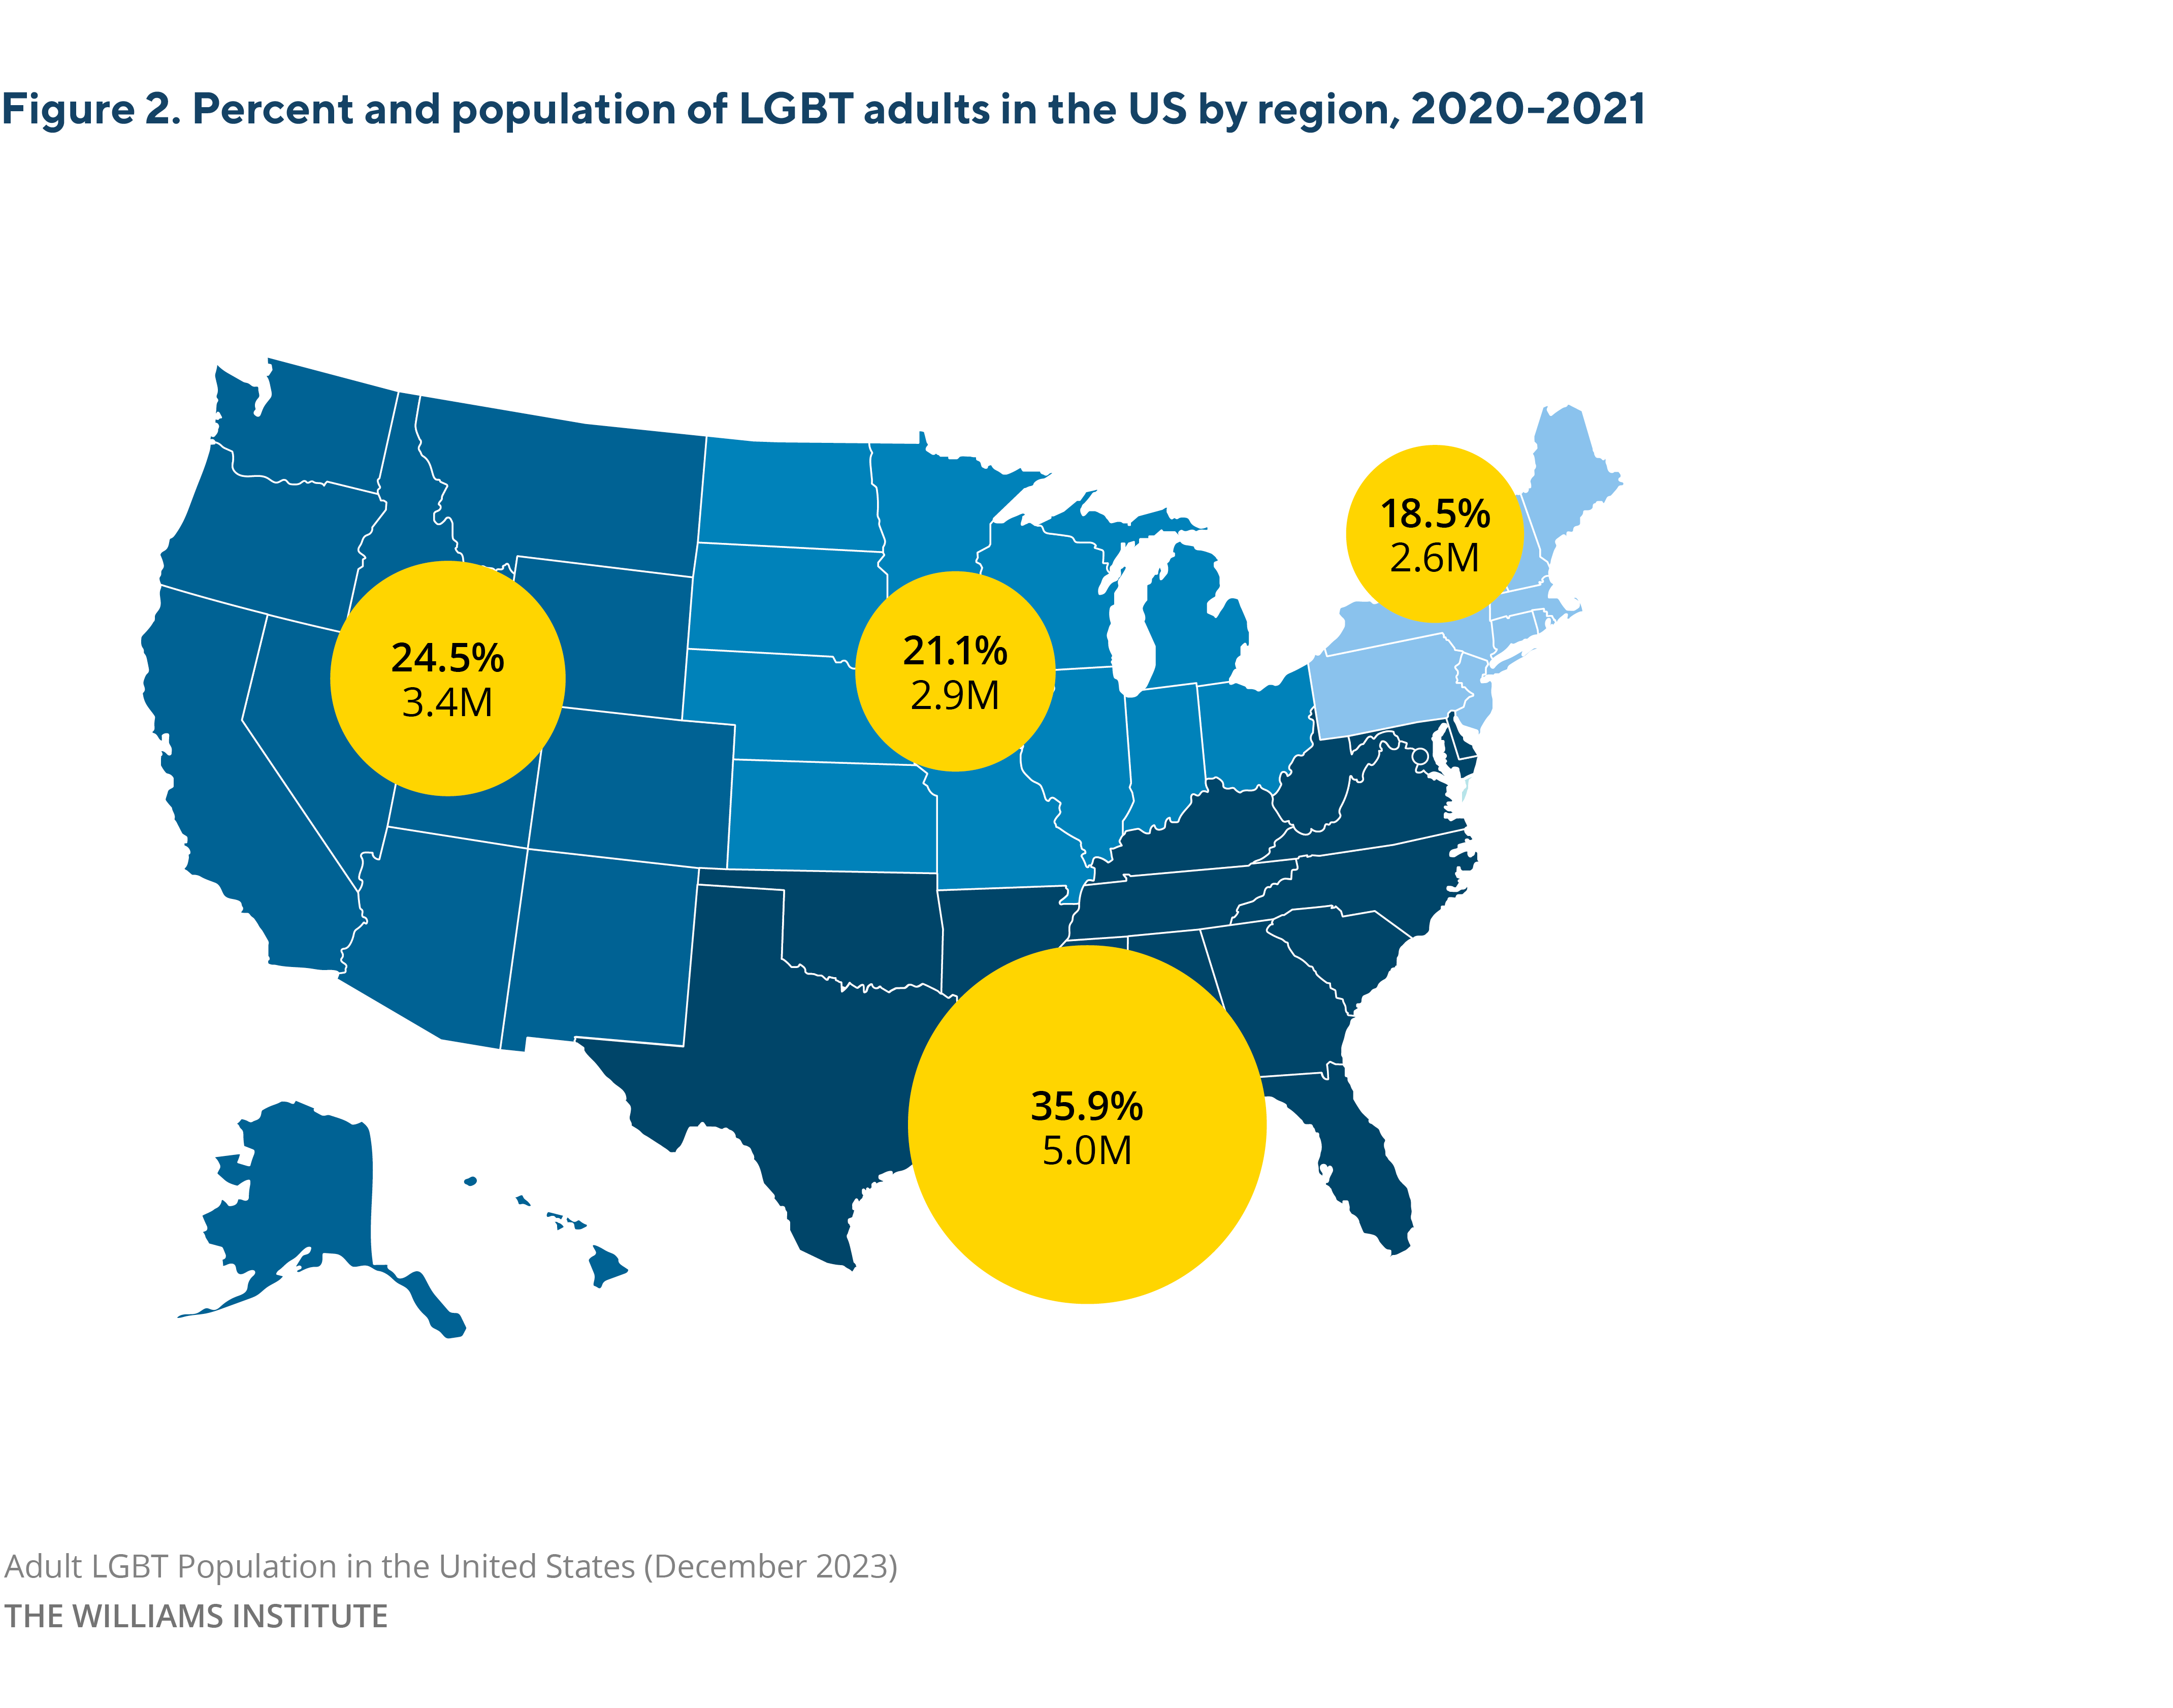
LGBT adults are more likely to live in the South than in other regions. 35.9% (5.0 million) of LGBT adults are in the South, 24.5% (3.4 million) in the West, 21.1% (2.9 million) in the Midwest, and 18.5% (2.6 million) in the Northeast. By state, California at 1.5 million and Texas at 1.1 million have the largest LGBT adult populations, while the District of Columbia at 14.3% and Oregon at 7.8% have the highest percentages of each district/state’s population.
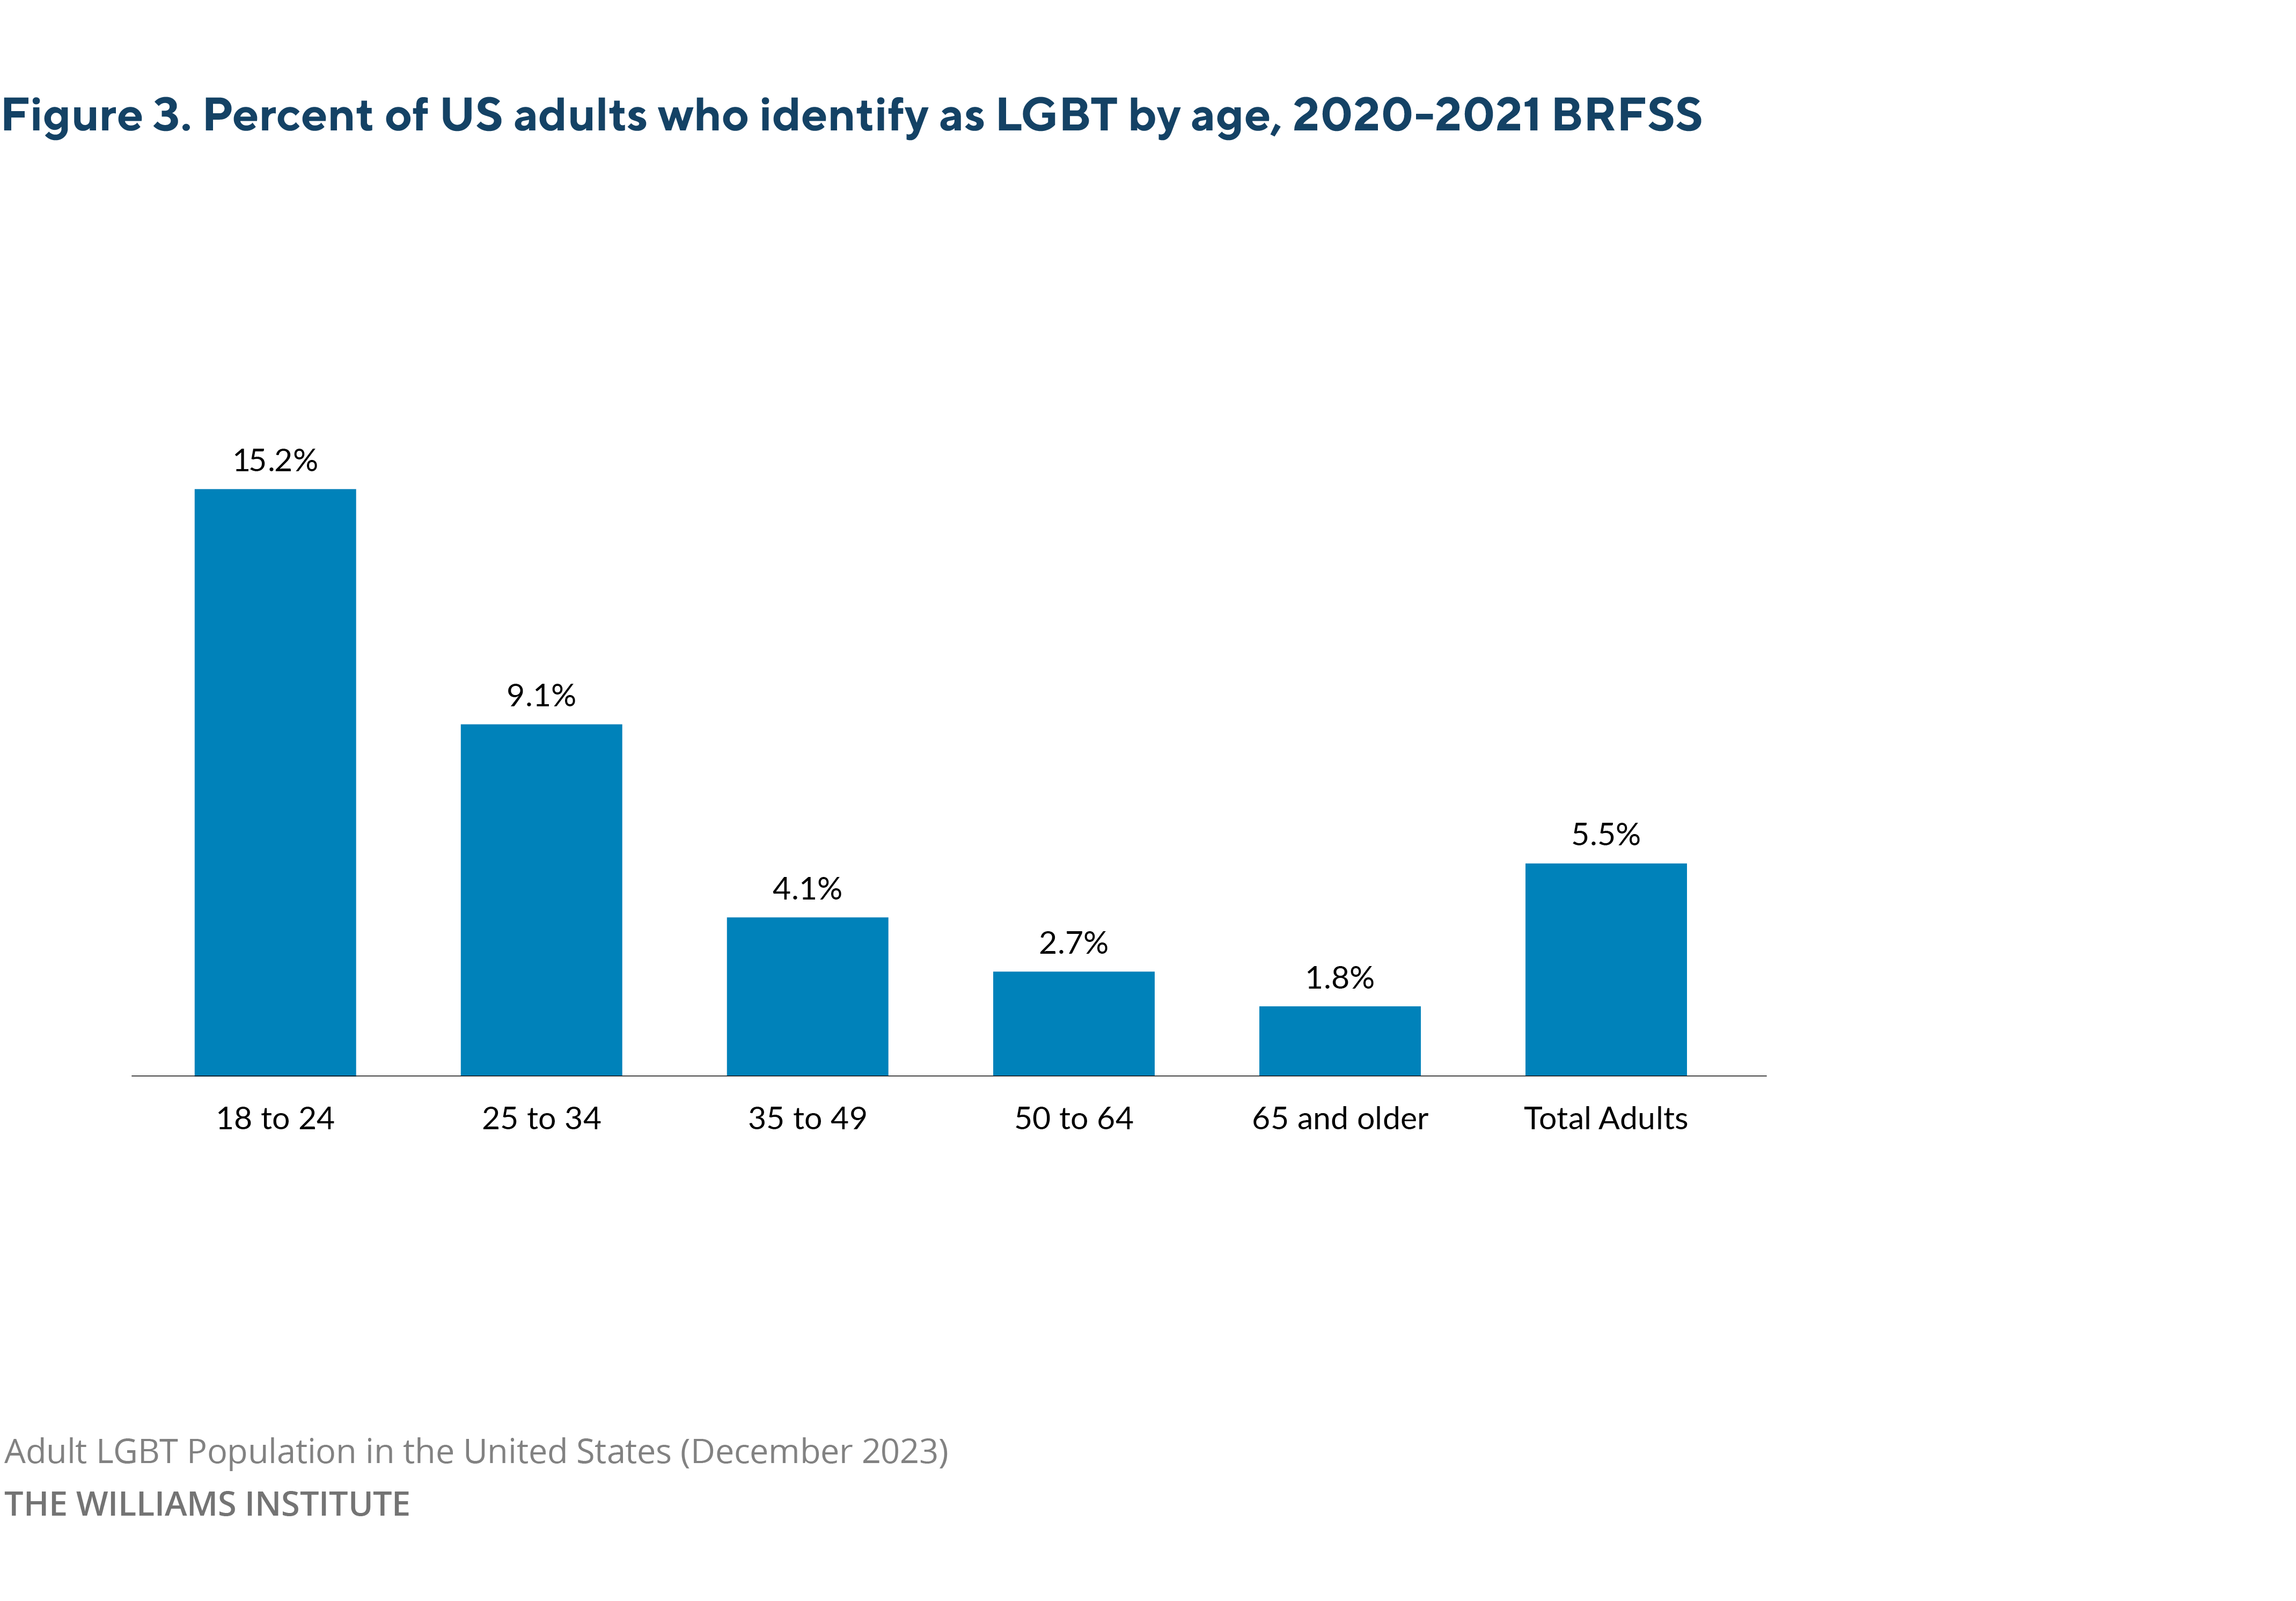
By age group, a higher share of younger age groups identifies as LGBT compared to older age groups. 15.2% of U.S. young adults (ages 18-24) identify as LGBT compared to only 1.8% of U.S. seniors (65 and older). Pew Research Center and Gallup show similar patterns.
Asian American and NHPI LGBT adult population
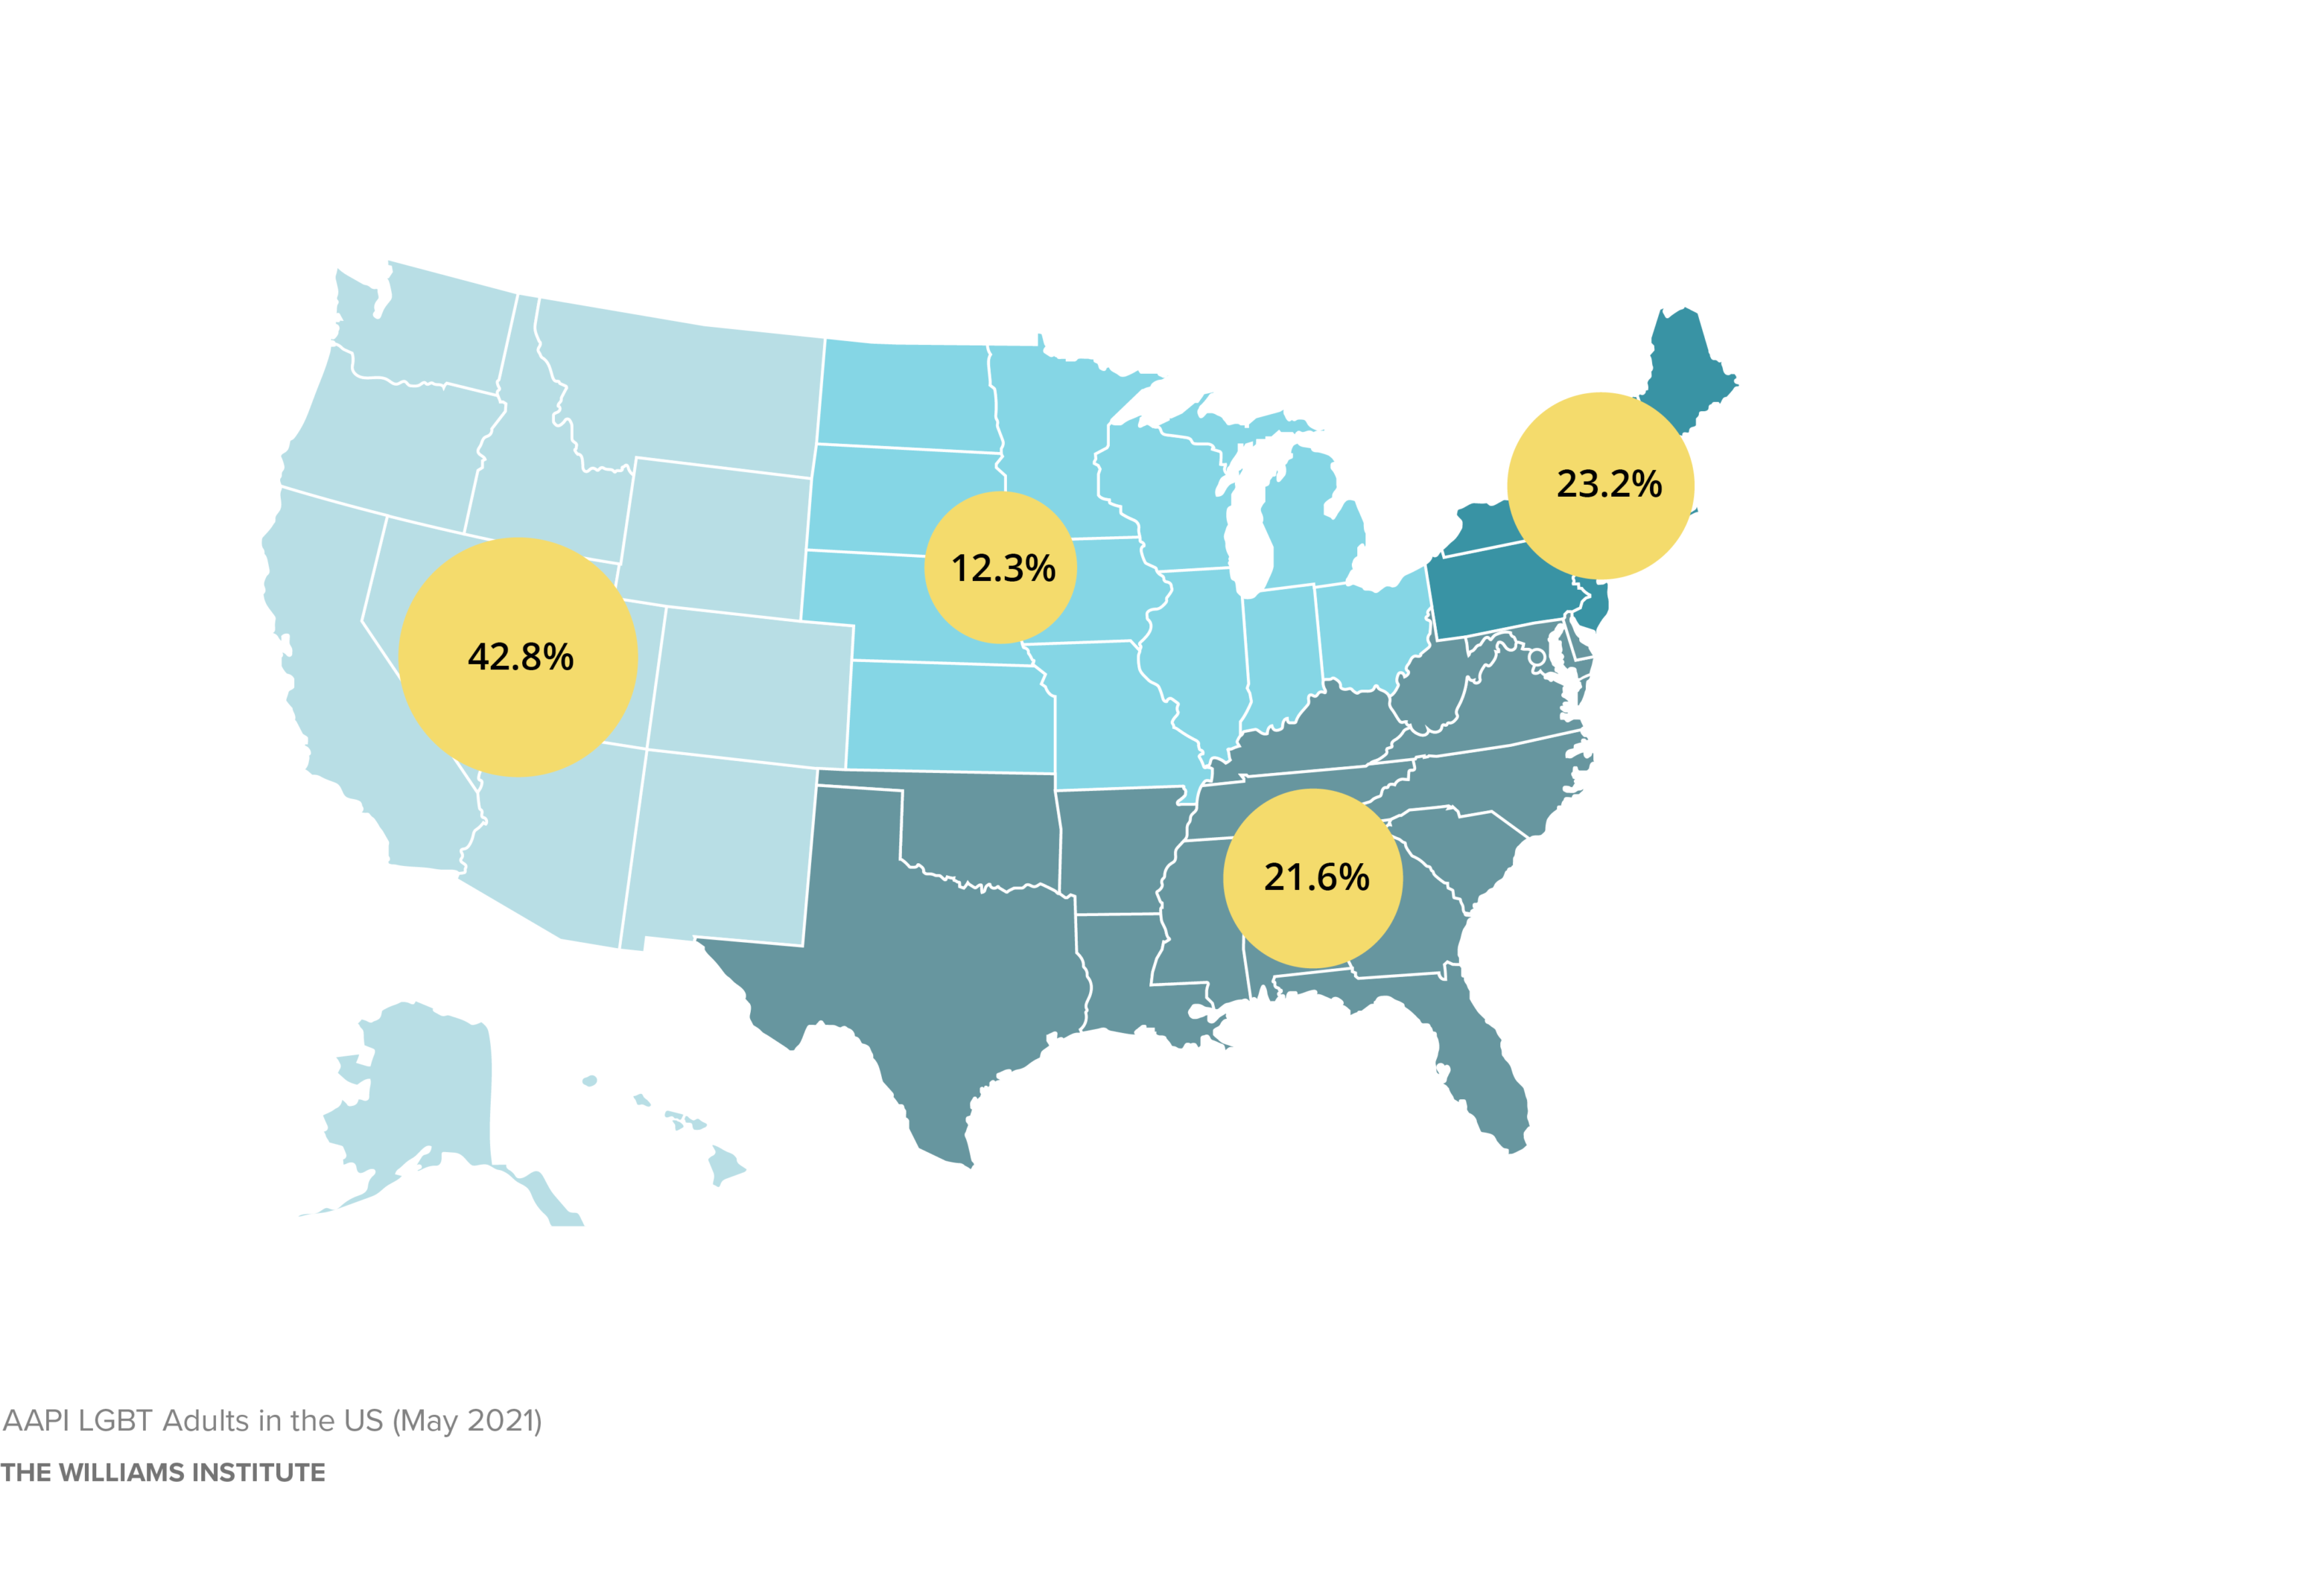
685,000 Asian Americans and NHPI adults identify as LGBT in America, consisting of 559,000 Asian American and 40,000 Native Hawaiian and Pacific Islander adults (these estimates may not add up). They more likely to live in the West than in other regions. 42.8% (294,000) are in the West, 23.2% (159,000) in the Northeast, 21.6% (148,000) in the South, and 12.3% (84,000) in the Midwest.
Intersectionality of the Asian American (AA) and NHPI LGBT adults
Regardless of population size, Asian American and NHPI LGBT individuals face unique intersectionality related to their marginalized identities. They are more likely to experience mental distress and economic insecurity.
Mental health
- 30% of Asian American and NHPI LGBT women have been diagnosed with depression compared to 9% of all Asian American and NHPI non-LGBT women.
- 21% of Asian American and NHPI LGBT adults have been diagnosed with depression compared to 7% of Asian American and NHPI LGBT non-LGBT adults.
- 71% of Asian American and NHPI transgender adults reported experiences of everyday discrimination, 56% reported experiencing physical assaults and threats, and 63% reported experiencing verbal assault or abuse.
Economic characteristics
- 21% of Asian American and NHPI LGBT adults live with an annual household income below $24,000 compared to 15% of Asian American and NHPI non-LGBT adults.
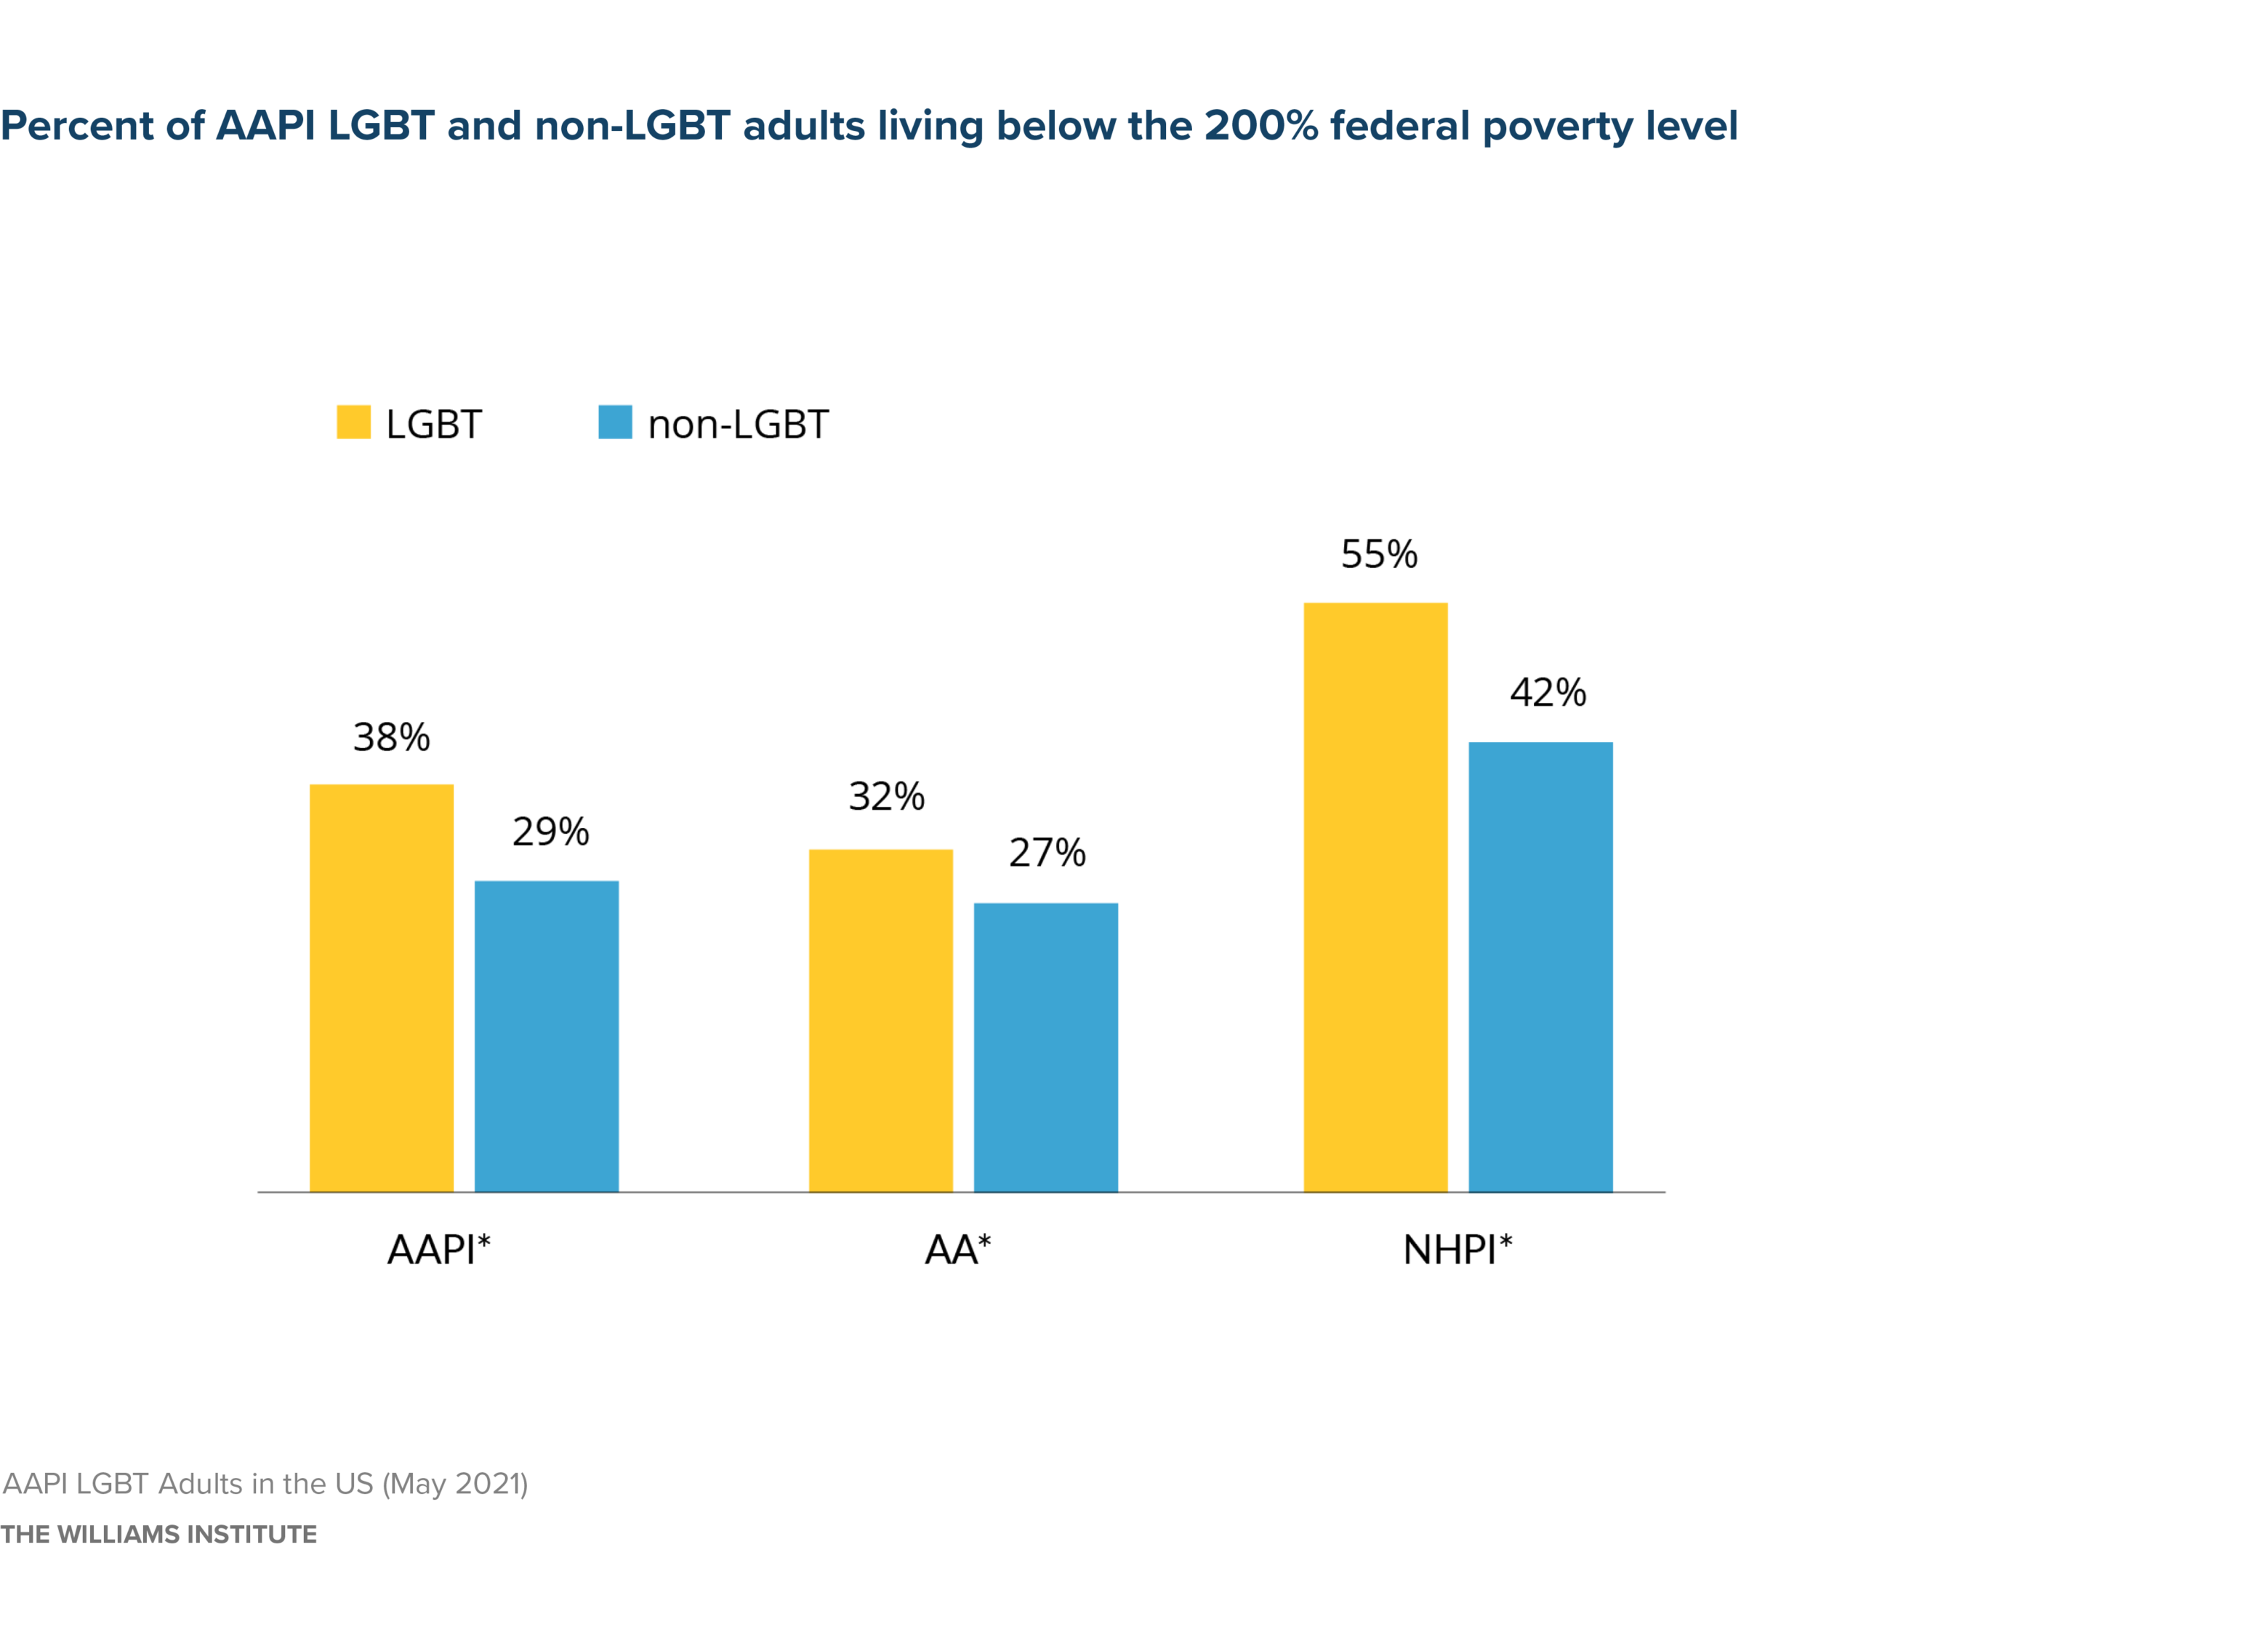
- 38% of Asian American and NHPI LGBT adults live in low-income households compared to 29% of Asian American and NHPI non-LGBT adults.
- 55% of NHPI LGBT adults—including 64% of NHPI LGBT women—live in low-income households.
Asian American and Pacific Islander LGBTQ youths
- Asian American and Pacific Islander LGBTQ youths (ages 13-24) face unique mental health challenges and increased racial/ethnic discrimination per a 2021 survey of nearly 3,600 LGBTQ Asian American and Pacific Islander youths.
Perceptions of American identity
Americans tend to view Asian American and NHPI LGBT individuals as more American. A series of studies, published in the journal of Social Psychological and Personality Science, by researchers at the University of Washington looked at the relationship between Asian American sexual orientation and American identity. The researchers found that Asian Americans identified as gay were perceived to be more American than Asian Americans whose sexual orientation was not identified.
They found that Americans view Asian culture as less LGBT-friendly, so a gay person from a less LGBT-friendly country of origin is viewed as more American. The researchers also noted that while sexual orientation may affect a person’s perceived “foreignness,” it does not protect against other forms of discrimination and harassment.
Helpful Resources
AAPI LGBT Adults in the US (May 2021, The Williams Institute)
Adult LGBT Population in the United States (December 2023, The Williams Institute)
The Mental Health and Well-Being of Asian American and Pacific Islander (AAPI) LGBTQ Youth (2022, The Trevor Project)
Gay Asian Americans Are Seen as More American Than Asian Americans Who Are Presumed Straight (2019, Social Psychological and Personality Science)
Get a monthly dose of our latest insights!


About
myasianvoice
At MyAsianVoice, we connect Asian Americans to surveys and research to bridge the Asian data gap.
Join our growing respondent list >>