Family, Government, Money, Resources
Asian American household spending and expenses
What are the buying habits or expenditures of Asian American households? Does the average Asian American household pay more in taxes or have higher expenses? Answers to these questions are in the Consumer Expenditure Survey (CE survey) by the Bureau of Labor Statistics. This annual survey collects information on U.S. household buying habits, income, and characteristics that is used in the calculation of the Consumer Price Index, a key measure of inflation. Per the latest CE survey, Asian American households have more income earners, higher incomes, higher expenses, and higher taxes. Their spending habits also differ from the average American household. While the CE survey is informative, there are limitations to the survey in capturing lower-income and limited English proficient Asian American households.

What are the buying habits or expenditures of Asian American households? Does the average Asian American household pay more in taxes or have higher expenses? Answers to these questions are in the Consumer Expenditure Survey (CE survey), done by the Census Bureau for the Bureau of Labor Statistics. This annual survey collects information from U.S. households and families on their buying habits (expenditures), income, and their characteristics. The CE survey captures all spending components including food, housing, apparel, transportation, entertainment, healthcare, retirement, and other spending.
American household expenditures by race and ethnicity
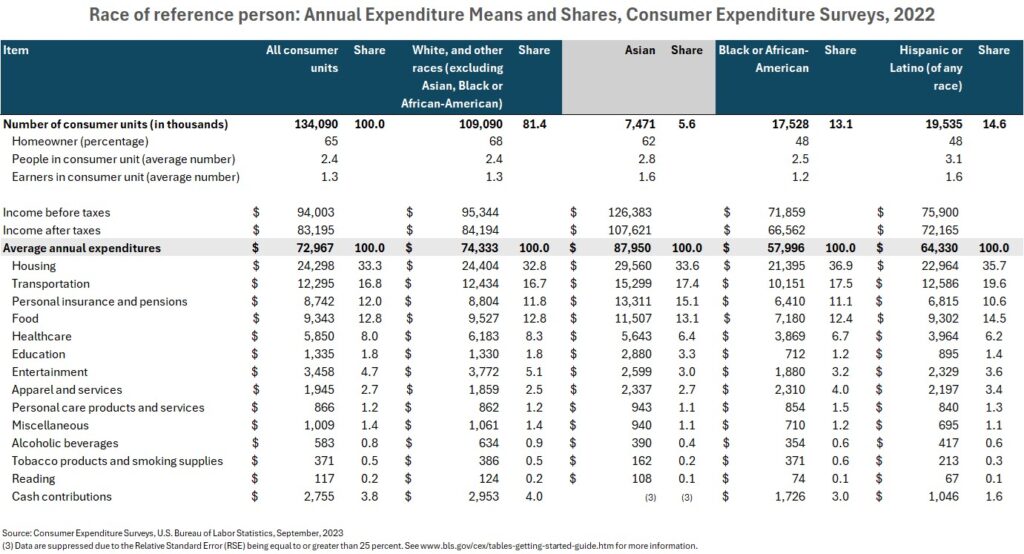
2022 was a year of peak inflation rates that had not been seen in the U.S. since 1980, as measured by the Consumer Price Index (CPI) for All Urban Consumers. The 2022 CPI reached a 9.1% increase over 2021. According to the latest CE survey, the average American household expenditure in 2022 was $72,967. Their average annual after-tax income was $83,195 (and before-tax income was $94,003). At 33.3%, Housing was the largest expenditure of American households. Other large expenditures include Transportation (16.8 %), Food (12.8%), Personal insurance and pensions (12.0%), and Healthcare (8%).
Asian American household expenditures
Asian American households have more income earners, higher incomes, higher expenses, and higher taxes. As such, Asian American households have the highest average annual expenditure at $87,950, 20% higher than that of the average U.S. household. This is partially due to more Asian Americans residing in high cost of living states such as California and New York and having a larger household size. For reference, the average annual household expenditure for California and New York were $80,528 and $76,749, respectively, higher than the national average of $72,967.
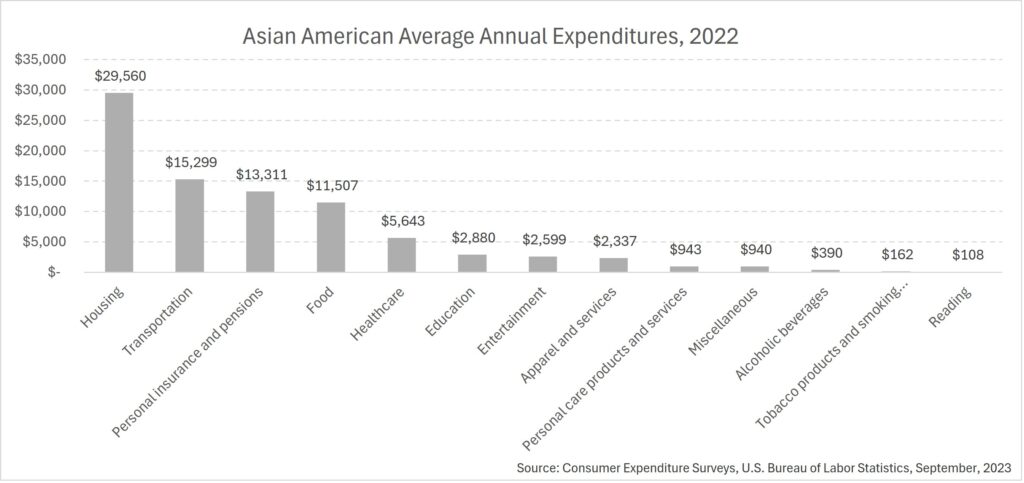
Housing is the largest expense (33.6%) for Asian American households, followed by Transportation (17.1%), Personal Insurance and Pension (15.1%), and Food (13.1%) – these combined expenses account for nearly 80% of their annual expenditure. Asian American households spend more on housing, transportation, retirement, and food than other racial groups.
Where Asian Americans spend
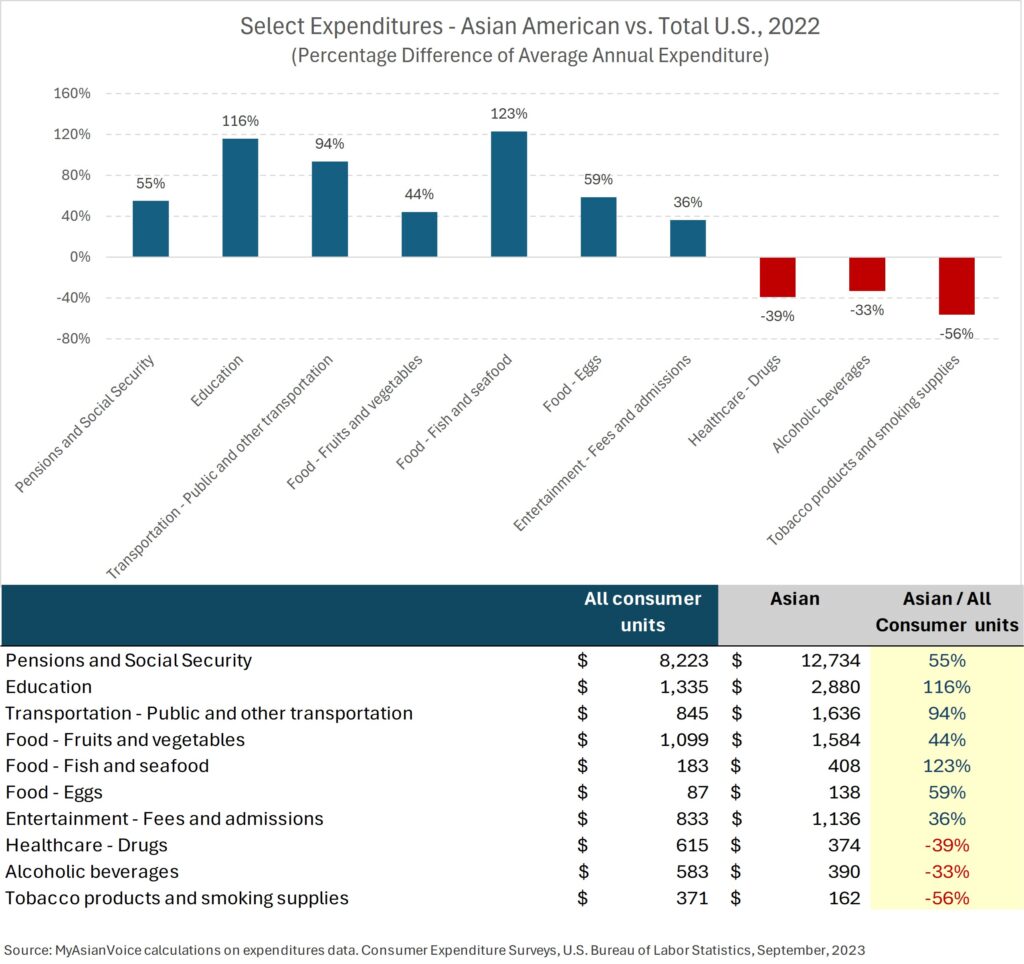
The average Asian American household expenses and buying habits differ from those of the average American household. The following are some interesting differences:
Asian American Household vs. Total U.S. Household
- The highest spending racial group on Public and other transportation, which includes mass transit, taxis, and such.
- The highest spending racial group on Pensions and Social Security that includes retirement savings/pension plans and social security contributions.
- More than twice the average annual spending on Education, which includes tuition, fees, supplies, and equipment for schools ranging from nursery schools to colleges/universities.
- Notably higher spending on Fruits and vegetables, Fish and seafood, and Eggs.
- Lower spending on Entertainment that includes pets and equipment, but interestingly higher spending on Fees and admissions on recreational experiences such as clubs, memberships, sports, concerts, movies, and such.
- Notably lower spending on Healthcare- Drugs, Alcohol, and Tobacco.
Asian American household income and taxes
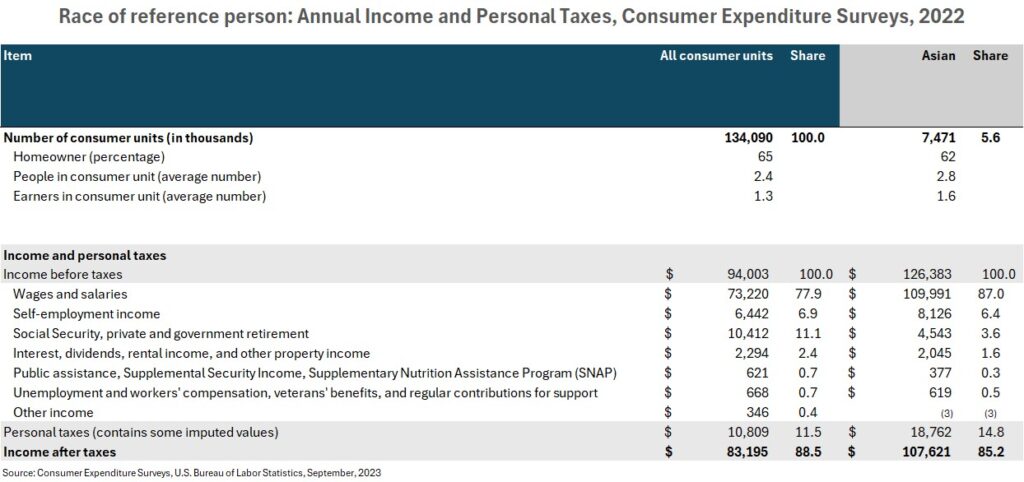
The average income of Asian American households as reported in the the CE survey is $126,383. Wages and salaries overwhelming make up 87% of their income, the highest share among all racial groups. Asian American households paid an average of $18,762 in taxes, the highest of all racial groups. Income from investments, public assistance programs, and social security/retirement are not significant income contributors to Asian American households.
Why is the CE survey important?
Since 1980, the CE survey is the only Federal survey to provide information on the complete range of consumers’ expenditures, incomes, and characteristics. Economic policymakers use this data to examine the impact of policy changes, the Census Bureau use it in its Supplemental Poverty Measure, businesses and academic researchers use it to study consumers’ spending habits and trends, and other Federal agencies use the CE survey data, most importantly, in the calculation of the Consumer Price Index.
Limitations to the CE survey
There are limitations to the CE survey in capturing the diversity of Asian American households as it does not disaggregate into Asian subgroups, where wide income disparities exist. Additionally, 30% of Asian American households have limited English proficiency. Low-income Asian American households with higher rates of limited English proficiency, may be underrepresented in the survey.
Useful Resources
Consumer Expenditure Surveys (U.S. Bureau of Labor Statistics)
Consumer Expenditures Surveys – Glossary (U.S. Bureau of Labor Statistics)
Get a monthly dose of our latest insights!


About
myasianvoice
At MyAsianVoice, we connect Asian Americans to surveys and research to bridge the Asian data gap.
Join our growing respondent list >>