Family, Government, Resources
A data guide to Chinese migrants at the border
Stifling political repression, a slowing Chinese economy, the emergence of social media as a conduit for irregular travel, all contributed to the rapid and sudden growth in the number of Chinese nationals who arrived at the U.S. southern border to present themselves for asylum. Most Chinese nationals arriving at the U.S. southern border are male, middle class, and under 40. The most detailed demographic data on Chinese migrants can be inferred from the Ecuadorian Statistical Registry of International Entries and Exits. This guide by the Niskanen Center is a compilation of some of these sources and offers valuable data insights.
Author: Gil Guerra, an Immigration Policy Analyst at the Niskanen Center, where he focuses on immigration and foreign policy, migrant integration, and demographic trends at the U.S.-Mexico border. Concurrently, he is also the 2024 Latin America Fellow with the Rising Experts Program at Young Professionals in Foreign Policy. This article originally appeared on Niskanen Center on July 24 2024, a nonprofit public policy organization dedicated to strengthening liberal democratic governance and promoting widespread prosperity, opportunity, and human flourishing.
Disclosure: MyAsianVoice is committed to publishing original and third-party content that is relevant and useful to the Asian female and beyond. The content posted are strictly the views of the authors’ own and does not reflect the views of MyAsianVoice.

The rapid and sudden growth in the number of Chinese nationals who arrived at the U.S. southern border to present themselves for asylum has ignited a storm of interest from the public, media, and lawmakers alike.
Unfortunately, there is a dearth of easily accessible information about who Chinese migrants are, how many are migrating, and where they are presenting themselves. By crossing through a number of countries, potential data on Chinese migrants is hosted in datasets dispersed among various government sources that have to be cleaned and sorted to allow for meaningful comparison.
This guide compiles some of these sources in an attempt to address this problem.
Demographic characteristics
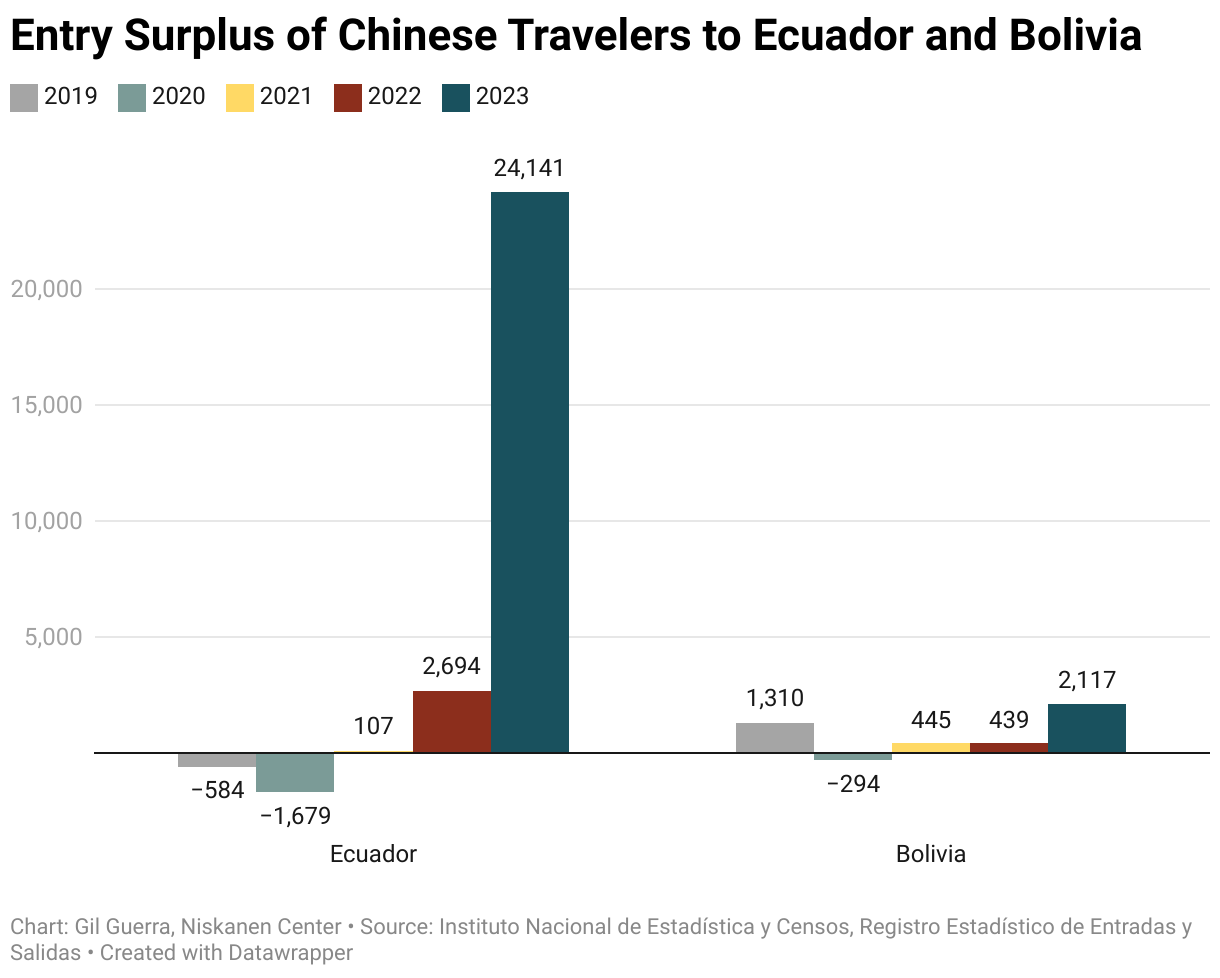
The most detailed demographic data on Chinese migrants can be inferred from the Ecuadorian Statistical Registry of International Entries and Exits. This is because, until recently, Ecuador was one of two mainland countries in the Western Hemisphere that offered visa-free travel to Chinese nationals. Reporting indicates that most migrants used Ecuador to enter the Americas, an assumption further supported by the net entry/exit numbers analyzed below which show that Chinese nationals entering Ecuador in 2023 had an estimated overstay rate of nearly 50%.
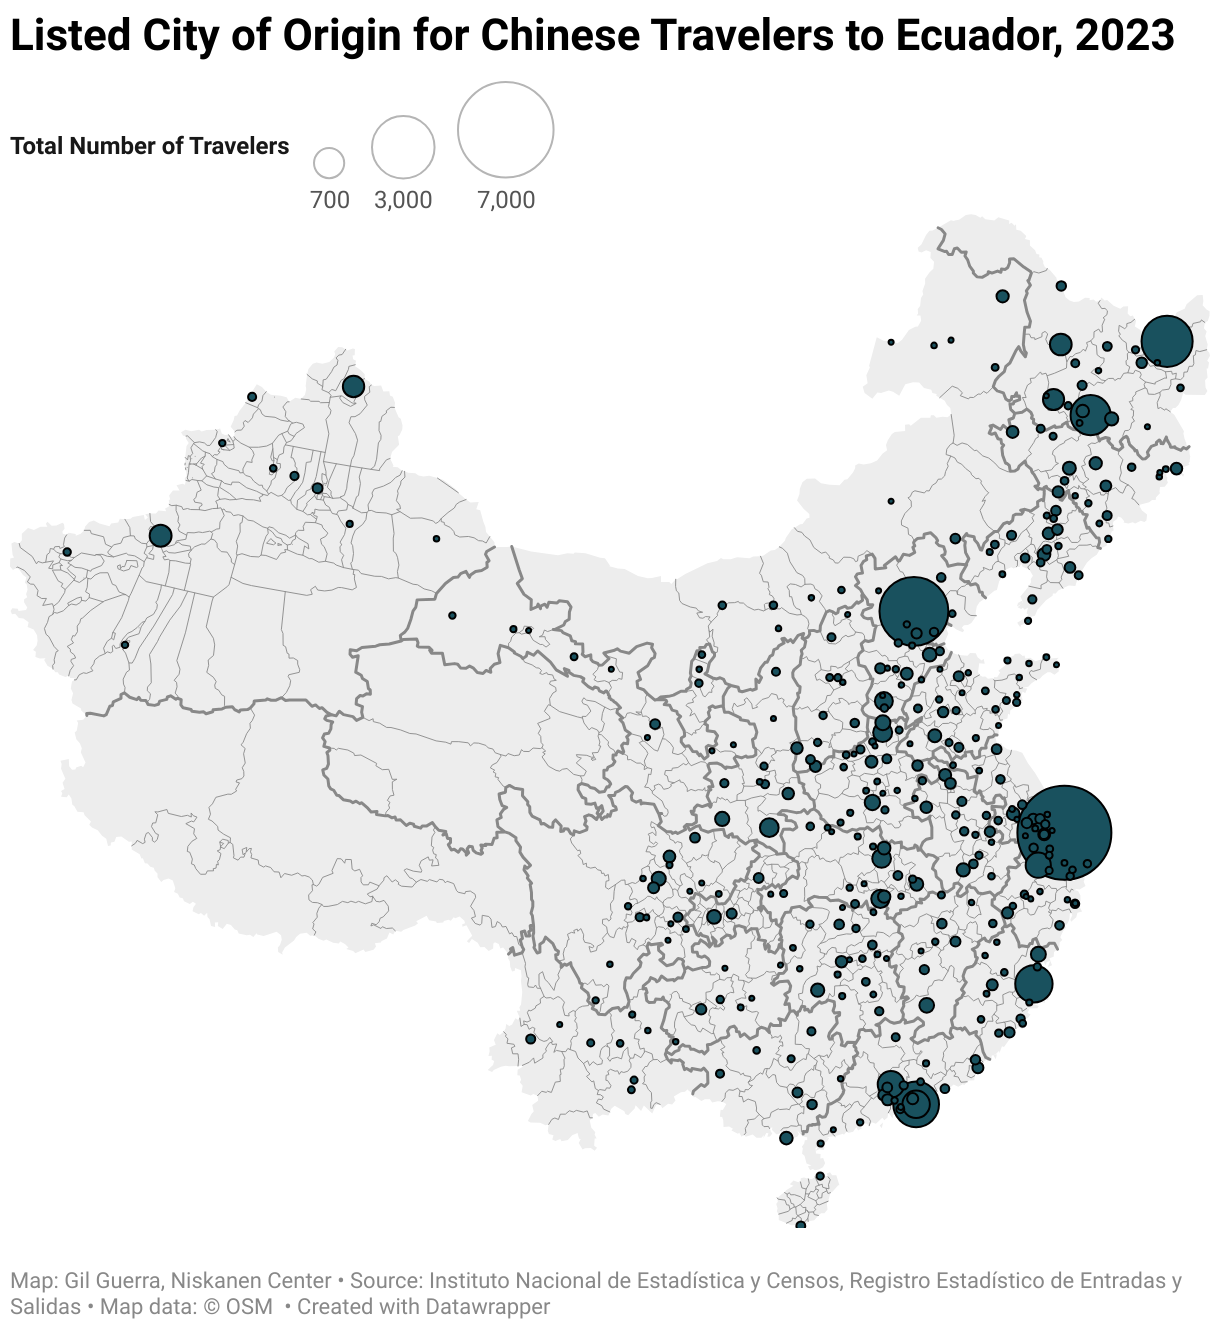
The Ecuadorian data captures the cities of origin listed by every Chinese traveler entering Ecuador in 2023. As we have previously written, areas experiencing repression such as Xinjiang, and economically struggling areas, such as Heilongjiang are overrepresented on a per capita basis in this data even as major cities such as Shanghai and Beijing make up a large share of the raw total.
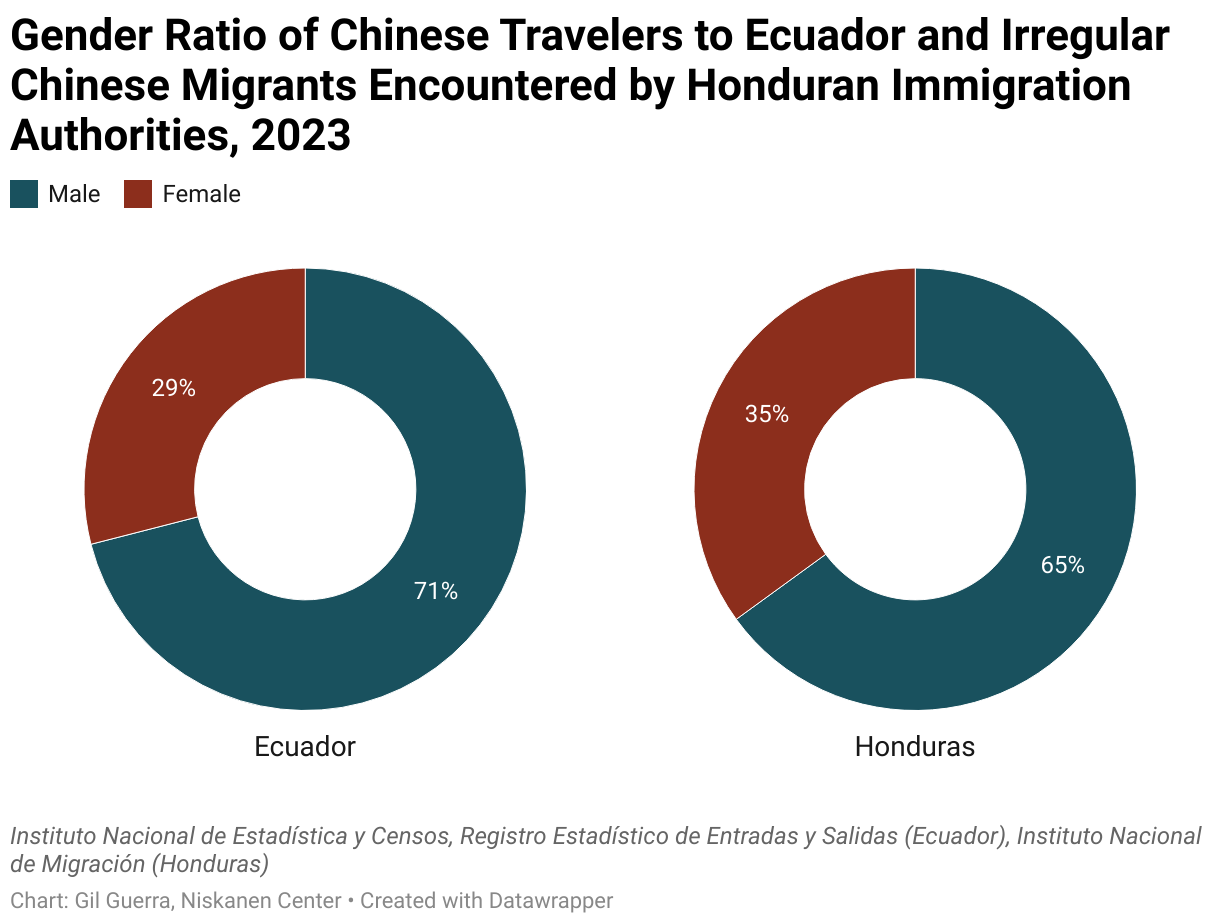
Much has also been made of the potential security implications related to Chinese migrants because most are “military aged men.” The available data indicates that most travelers are indeed young and male. Over 70% of travelers in the Ecuadorian data and 65% of irregular Chinese migrants encountered by Honduran immigration authorities during the same period were male.
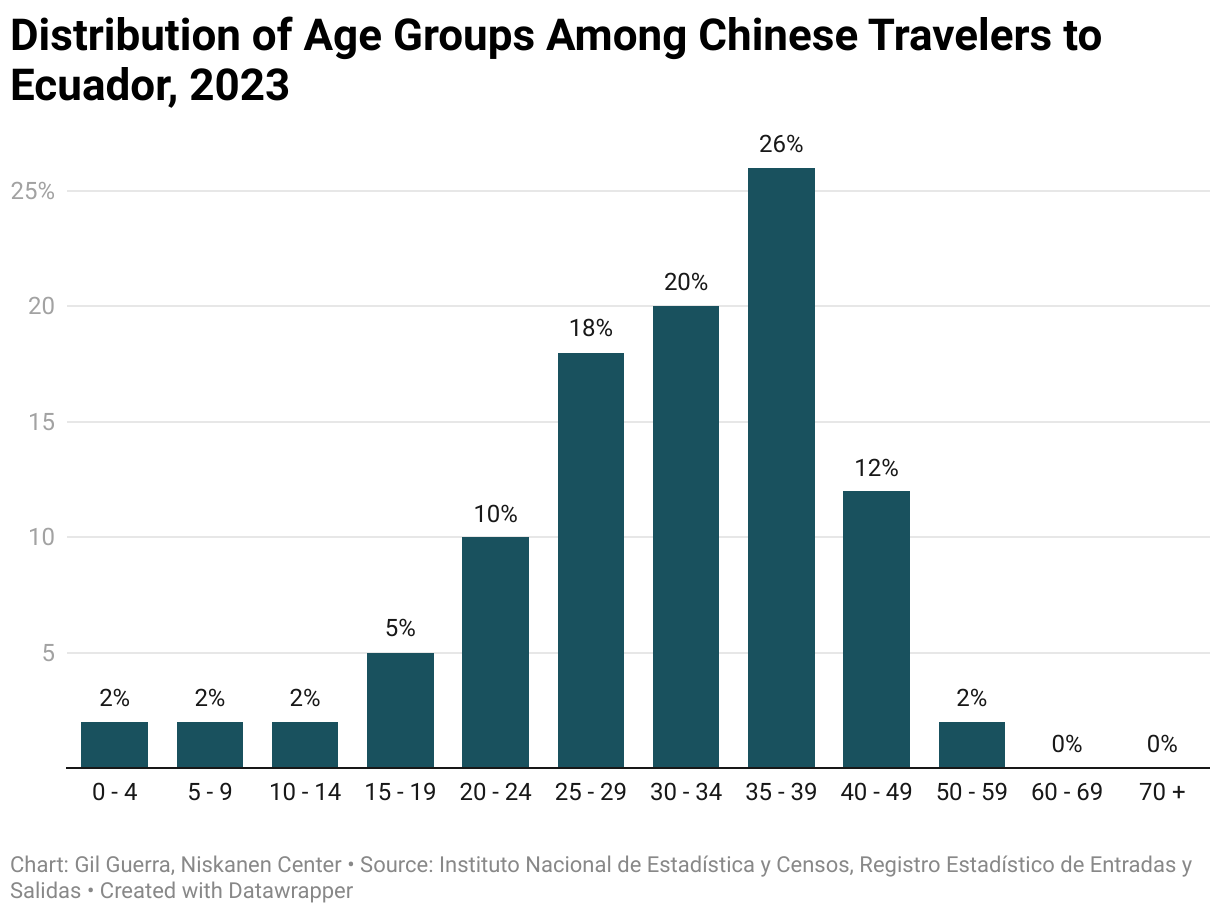
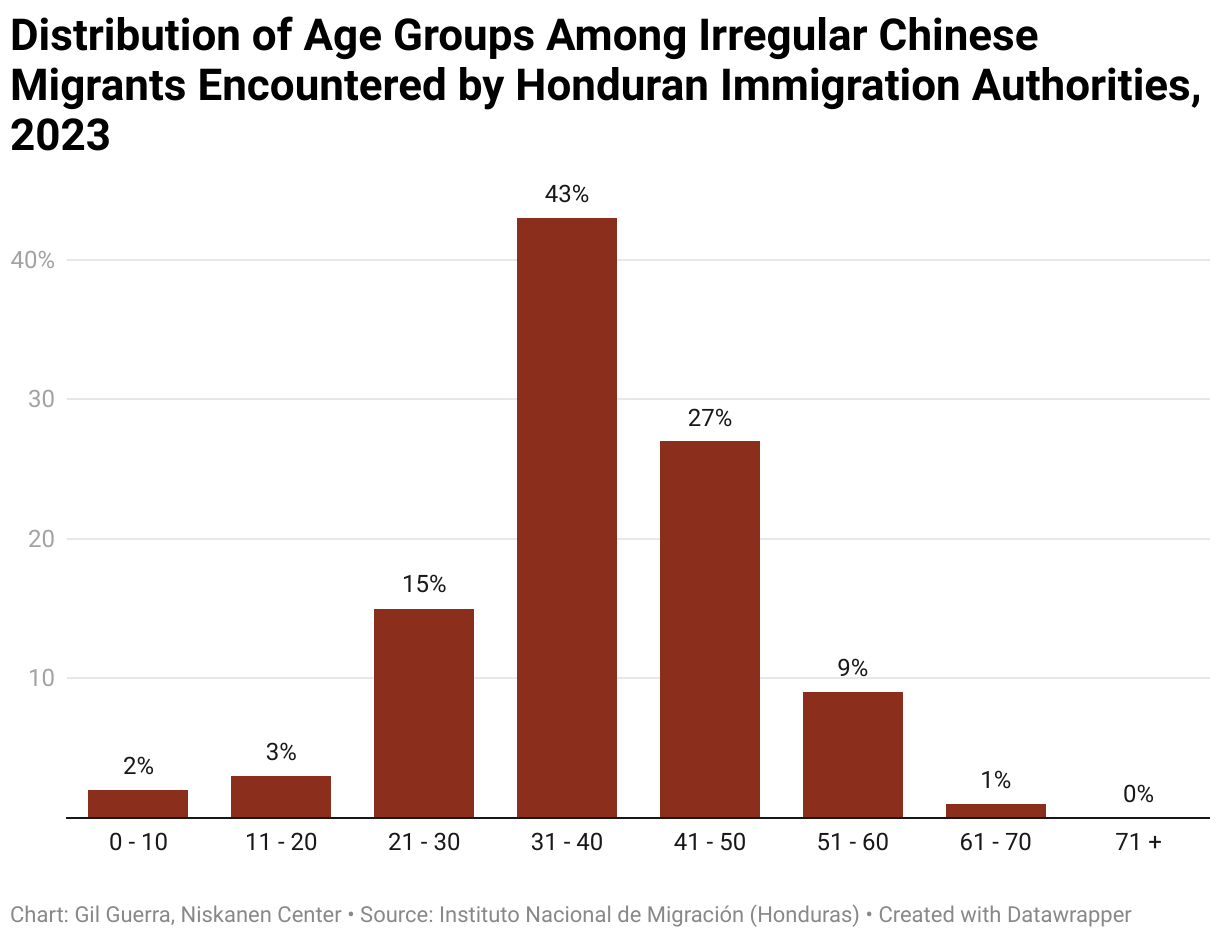
These sources also confirm that most of Chinese migrants are young. Almost half of the travelers recorded in the Ecuadorian data were in their thirties, while roughly 43% of those encountered by Honduran immigration were between the ages of 31 and 40.
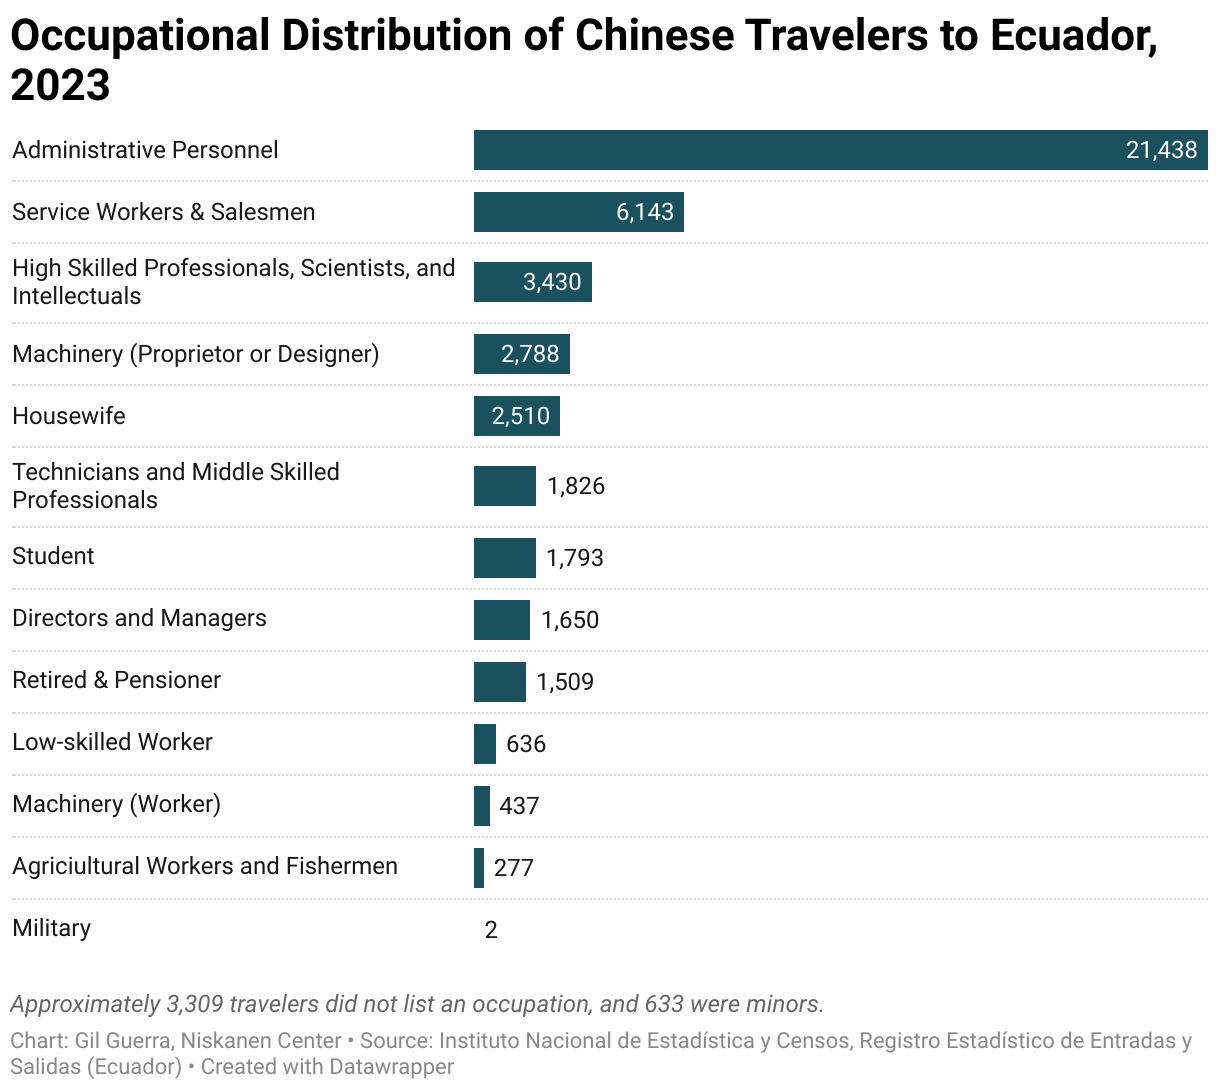
However, this should not be taken to lend support to the purported security concerns around Chinese migrants, as we have analyzed here. Reporting suggests that most of Chinese migrants are middle-class professionals leaving China due to a mix of political, economic, and social factors, which is supported by the distribution of occupations listed in the Ecuadorian entry data:
Numerical totals
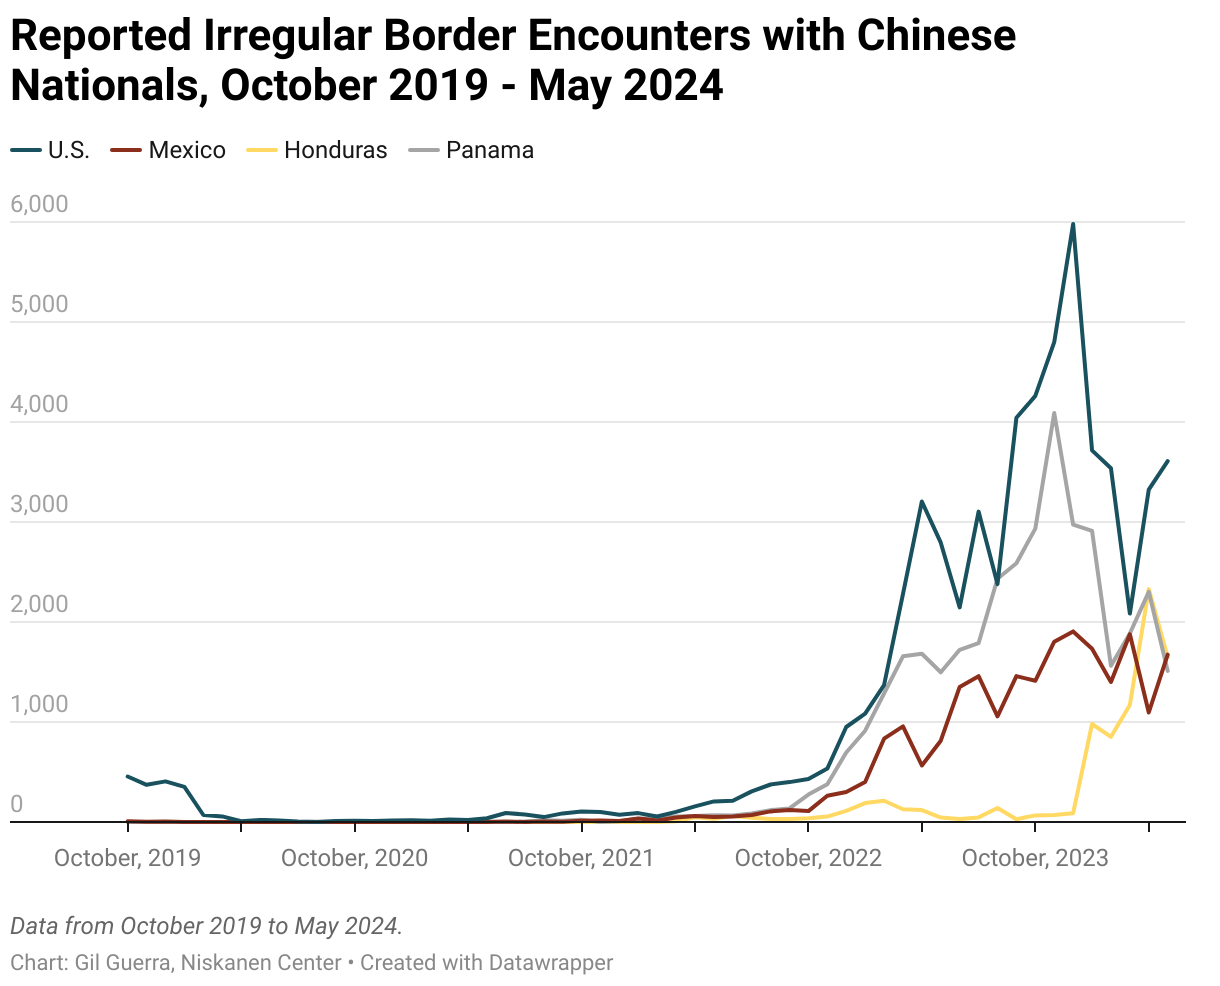
Four countries in the Americas directly record and publish encounters with irregular Chinese migrants. The following chart measures these encounters using data from the U.S. Customs and Border Protection Nationwide encounters database, the Mexican government’s Boletine Estadístico de Personas en situación migratoria irregular, the Honduran government’s database on irregular migration, and the Panamanian government’s records on irregular transit via the Darién Gap.
Using the annual travel data from Ecuador and Bolivia, which offer visas for Chinese nationals upon arrival, it is also possible to estimate annual overstay rates and potential irregular migration. While Suriname also offers visa-free travel for Chinese nationals, its government has not published detailed data beyond 2021.
Points of entry in the U.S.
The U.S. Customs and Border Protection data also lists encounters by sector. Roughly 99% of encounters with irregular Chinese migrants in Fiscal Year 2024 have occurred in California, driven by a sudden shift from the Rio Grande Valley sector in Texas that began in June of 2023.
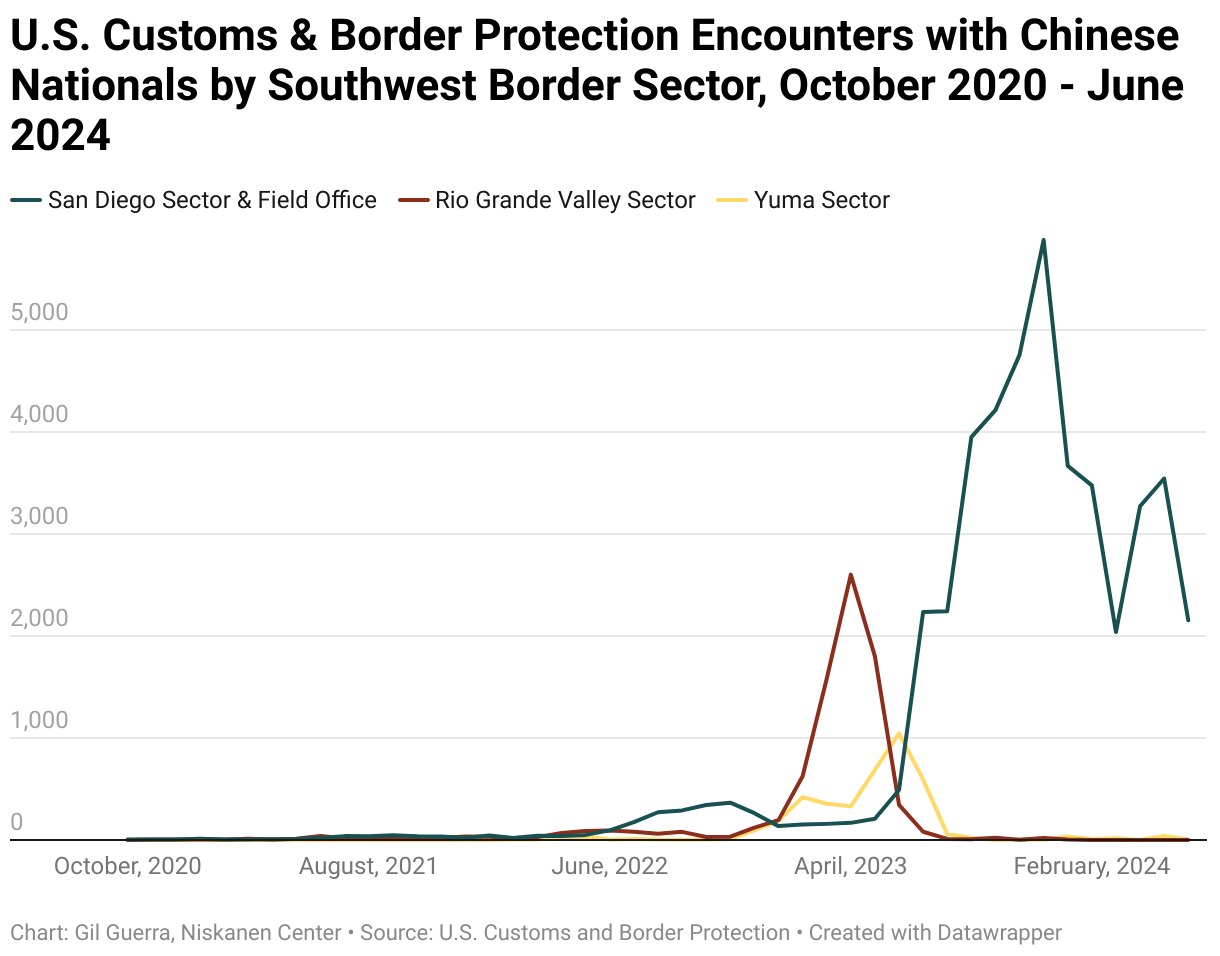
This means that in the span of just a few months, the primary route taken by Chinese migrants shifted by over 1,500 miles. The adaptability and resilience of this migration could mean that even major disruptions such as the rescission of Ecuador’s visa-free policy for Chinese travelers on June 1st, 2024, may only redirect Chinese migrants and not deter them.
Helpful Resources
New data suggests political repression, slowing economy driving irregular Chinese migration to U.S. (Nikansen Center)
What we know about unauthorized immigrants living in the U.S. (Pew Research Center)
Get a monthly dose of our latest insights!


About
myasianvoice
At MyAsianVoice, we make disaggregated U.S. Asian data visible and accessible.
Subscribe to receive our latest insights >>